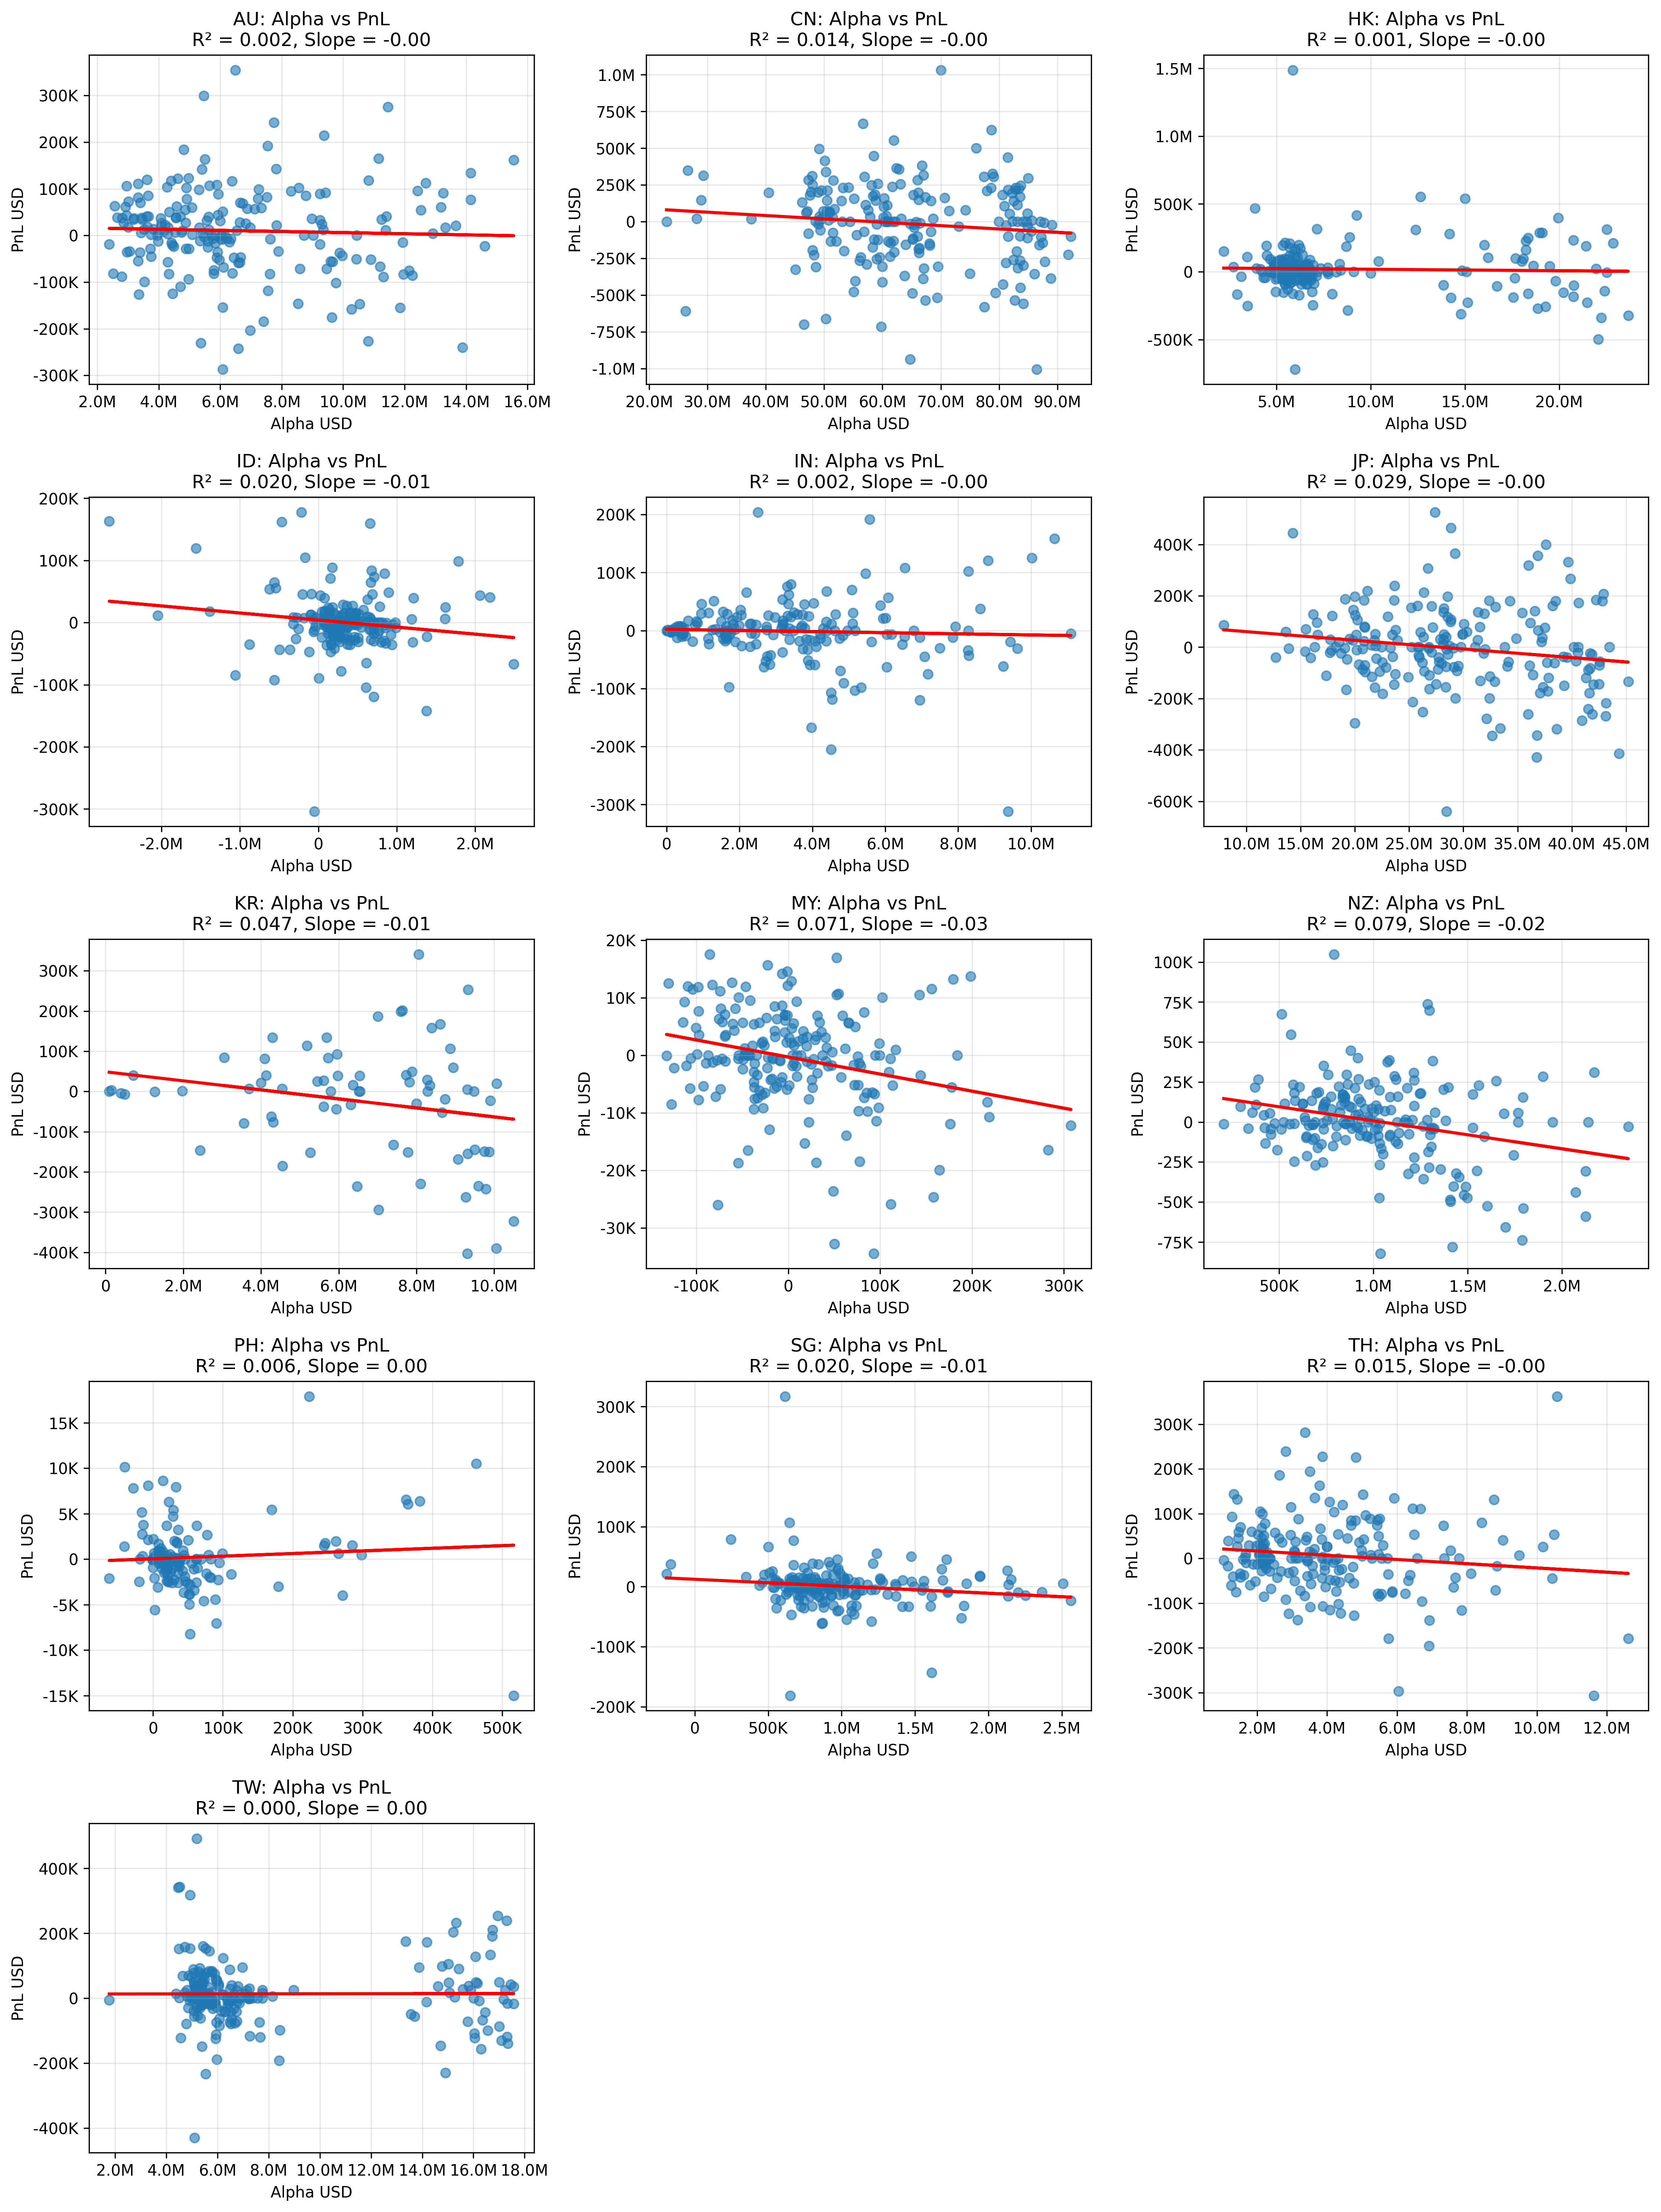
Regression Scatter Plots
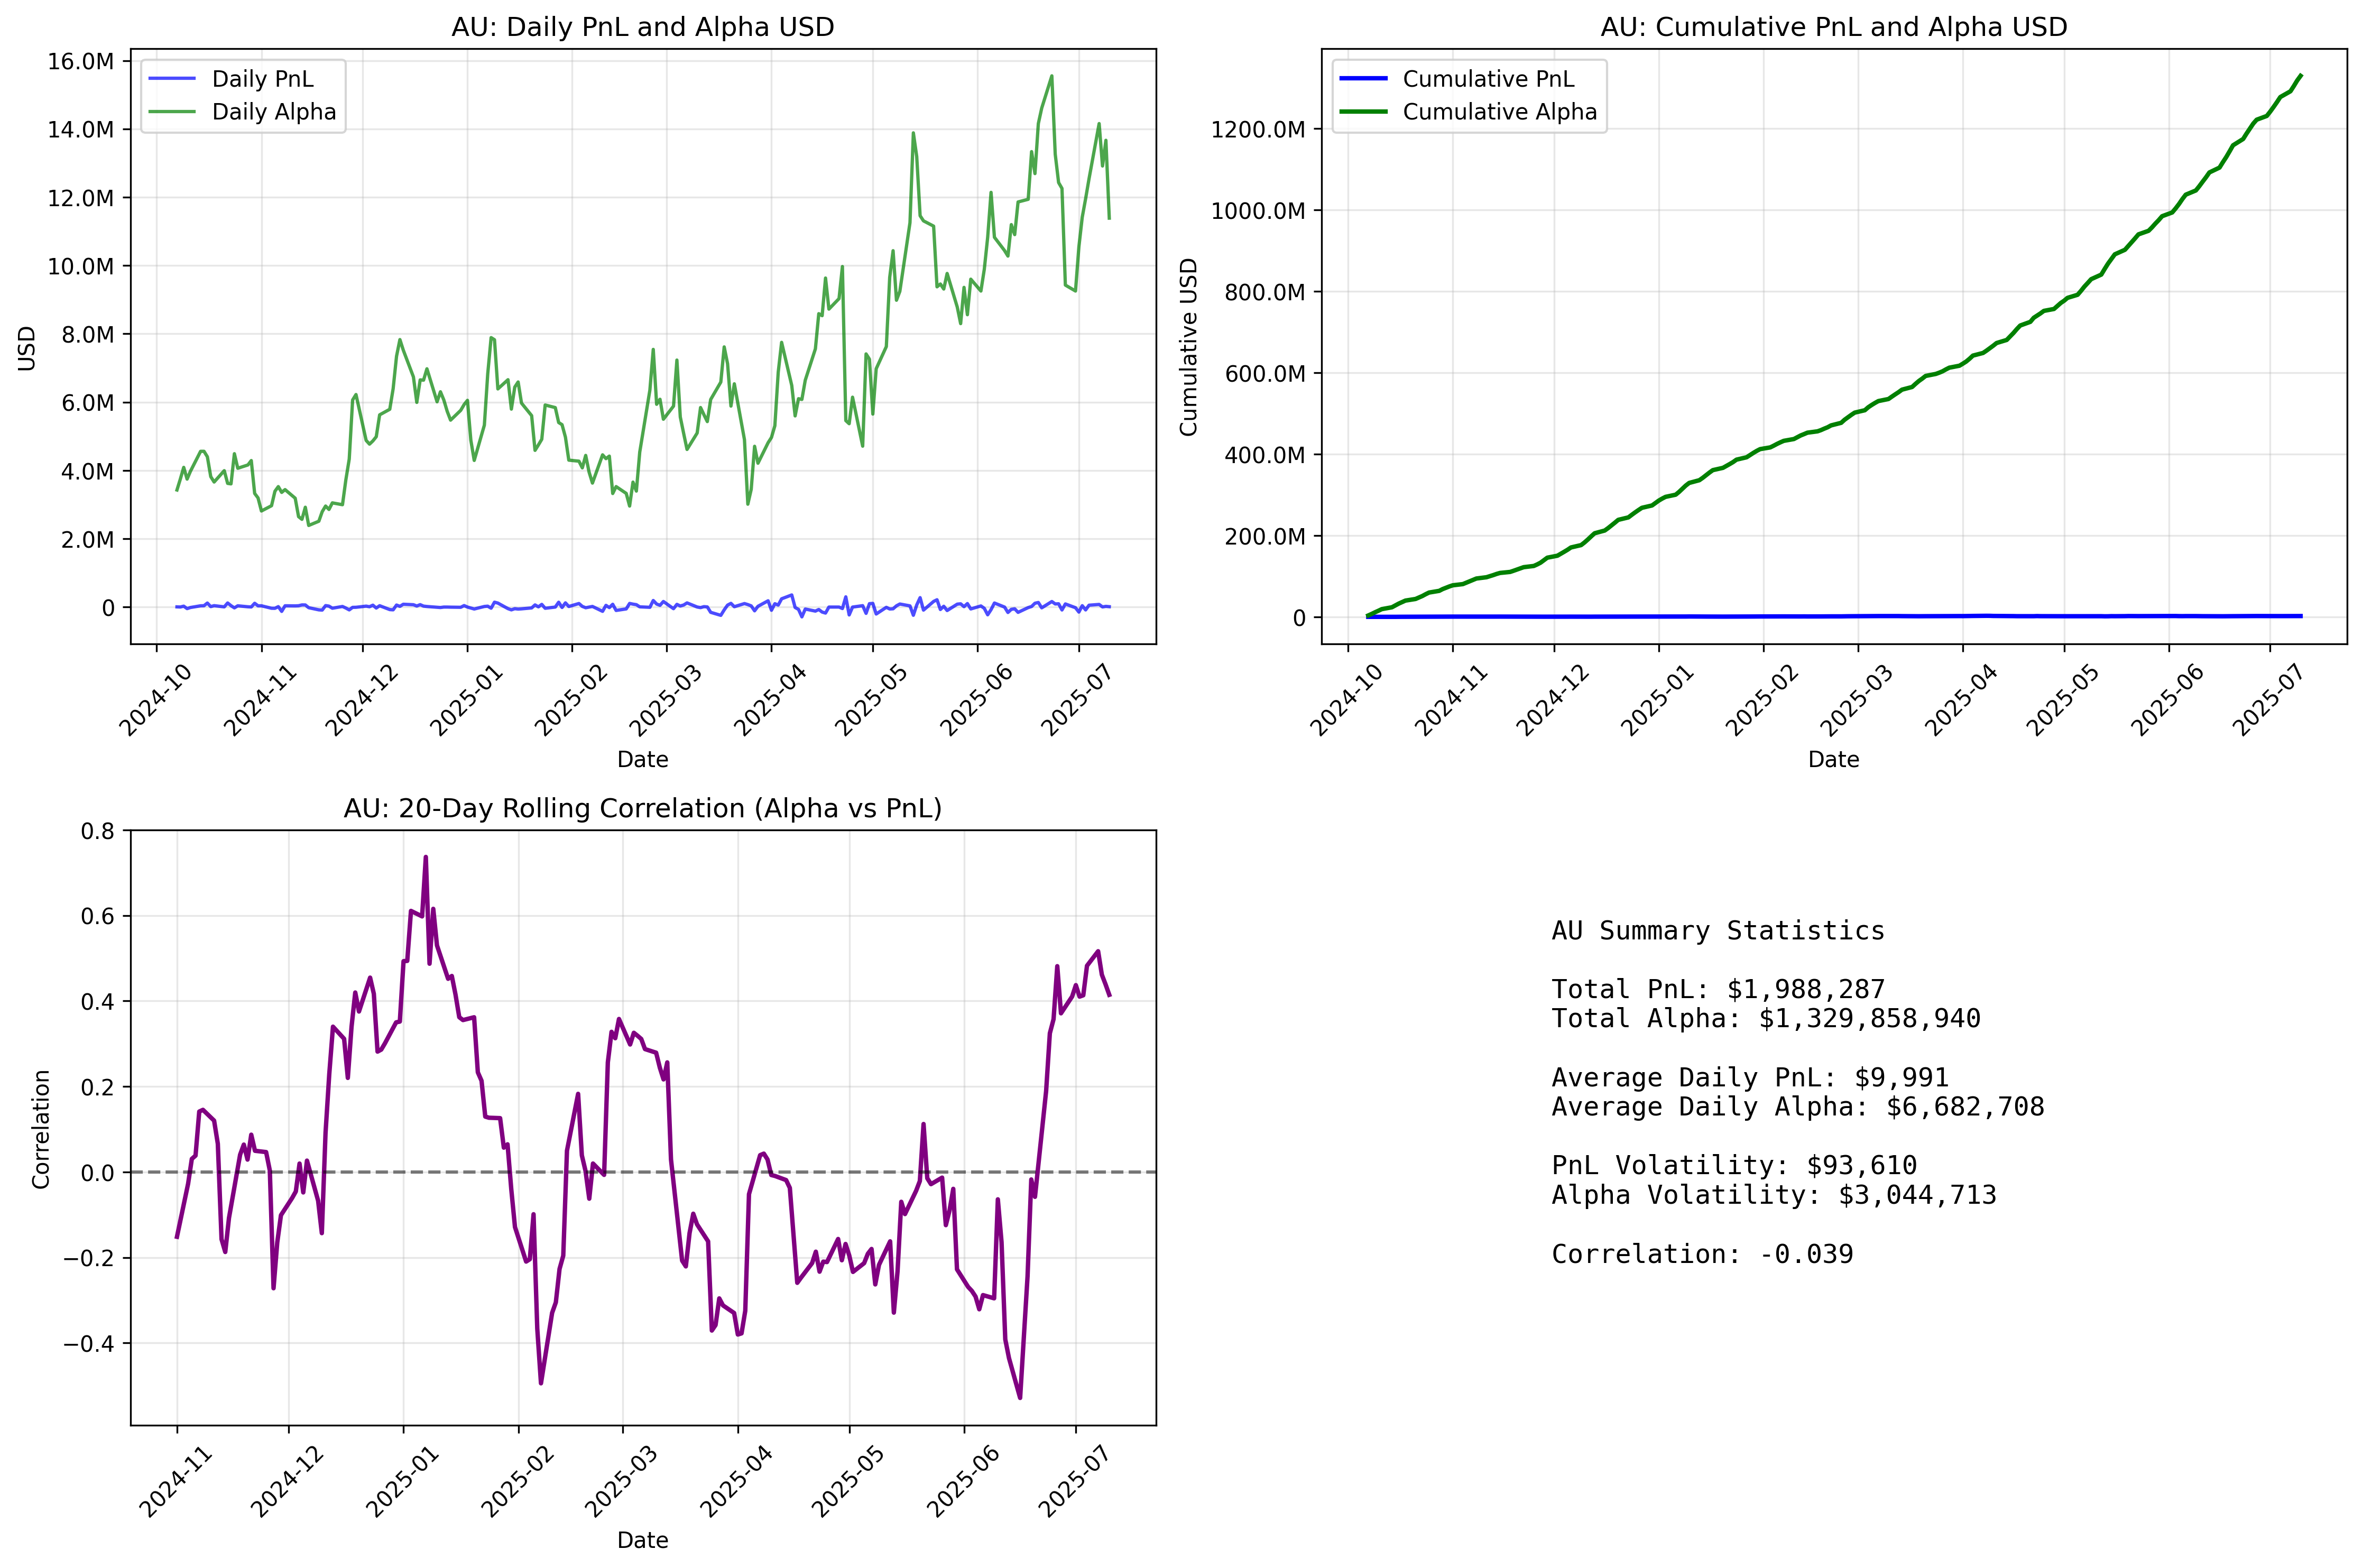
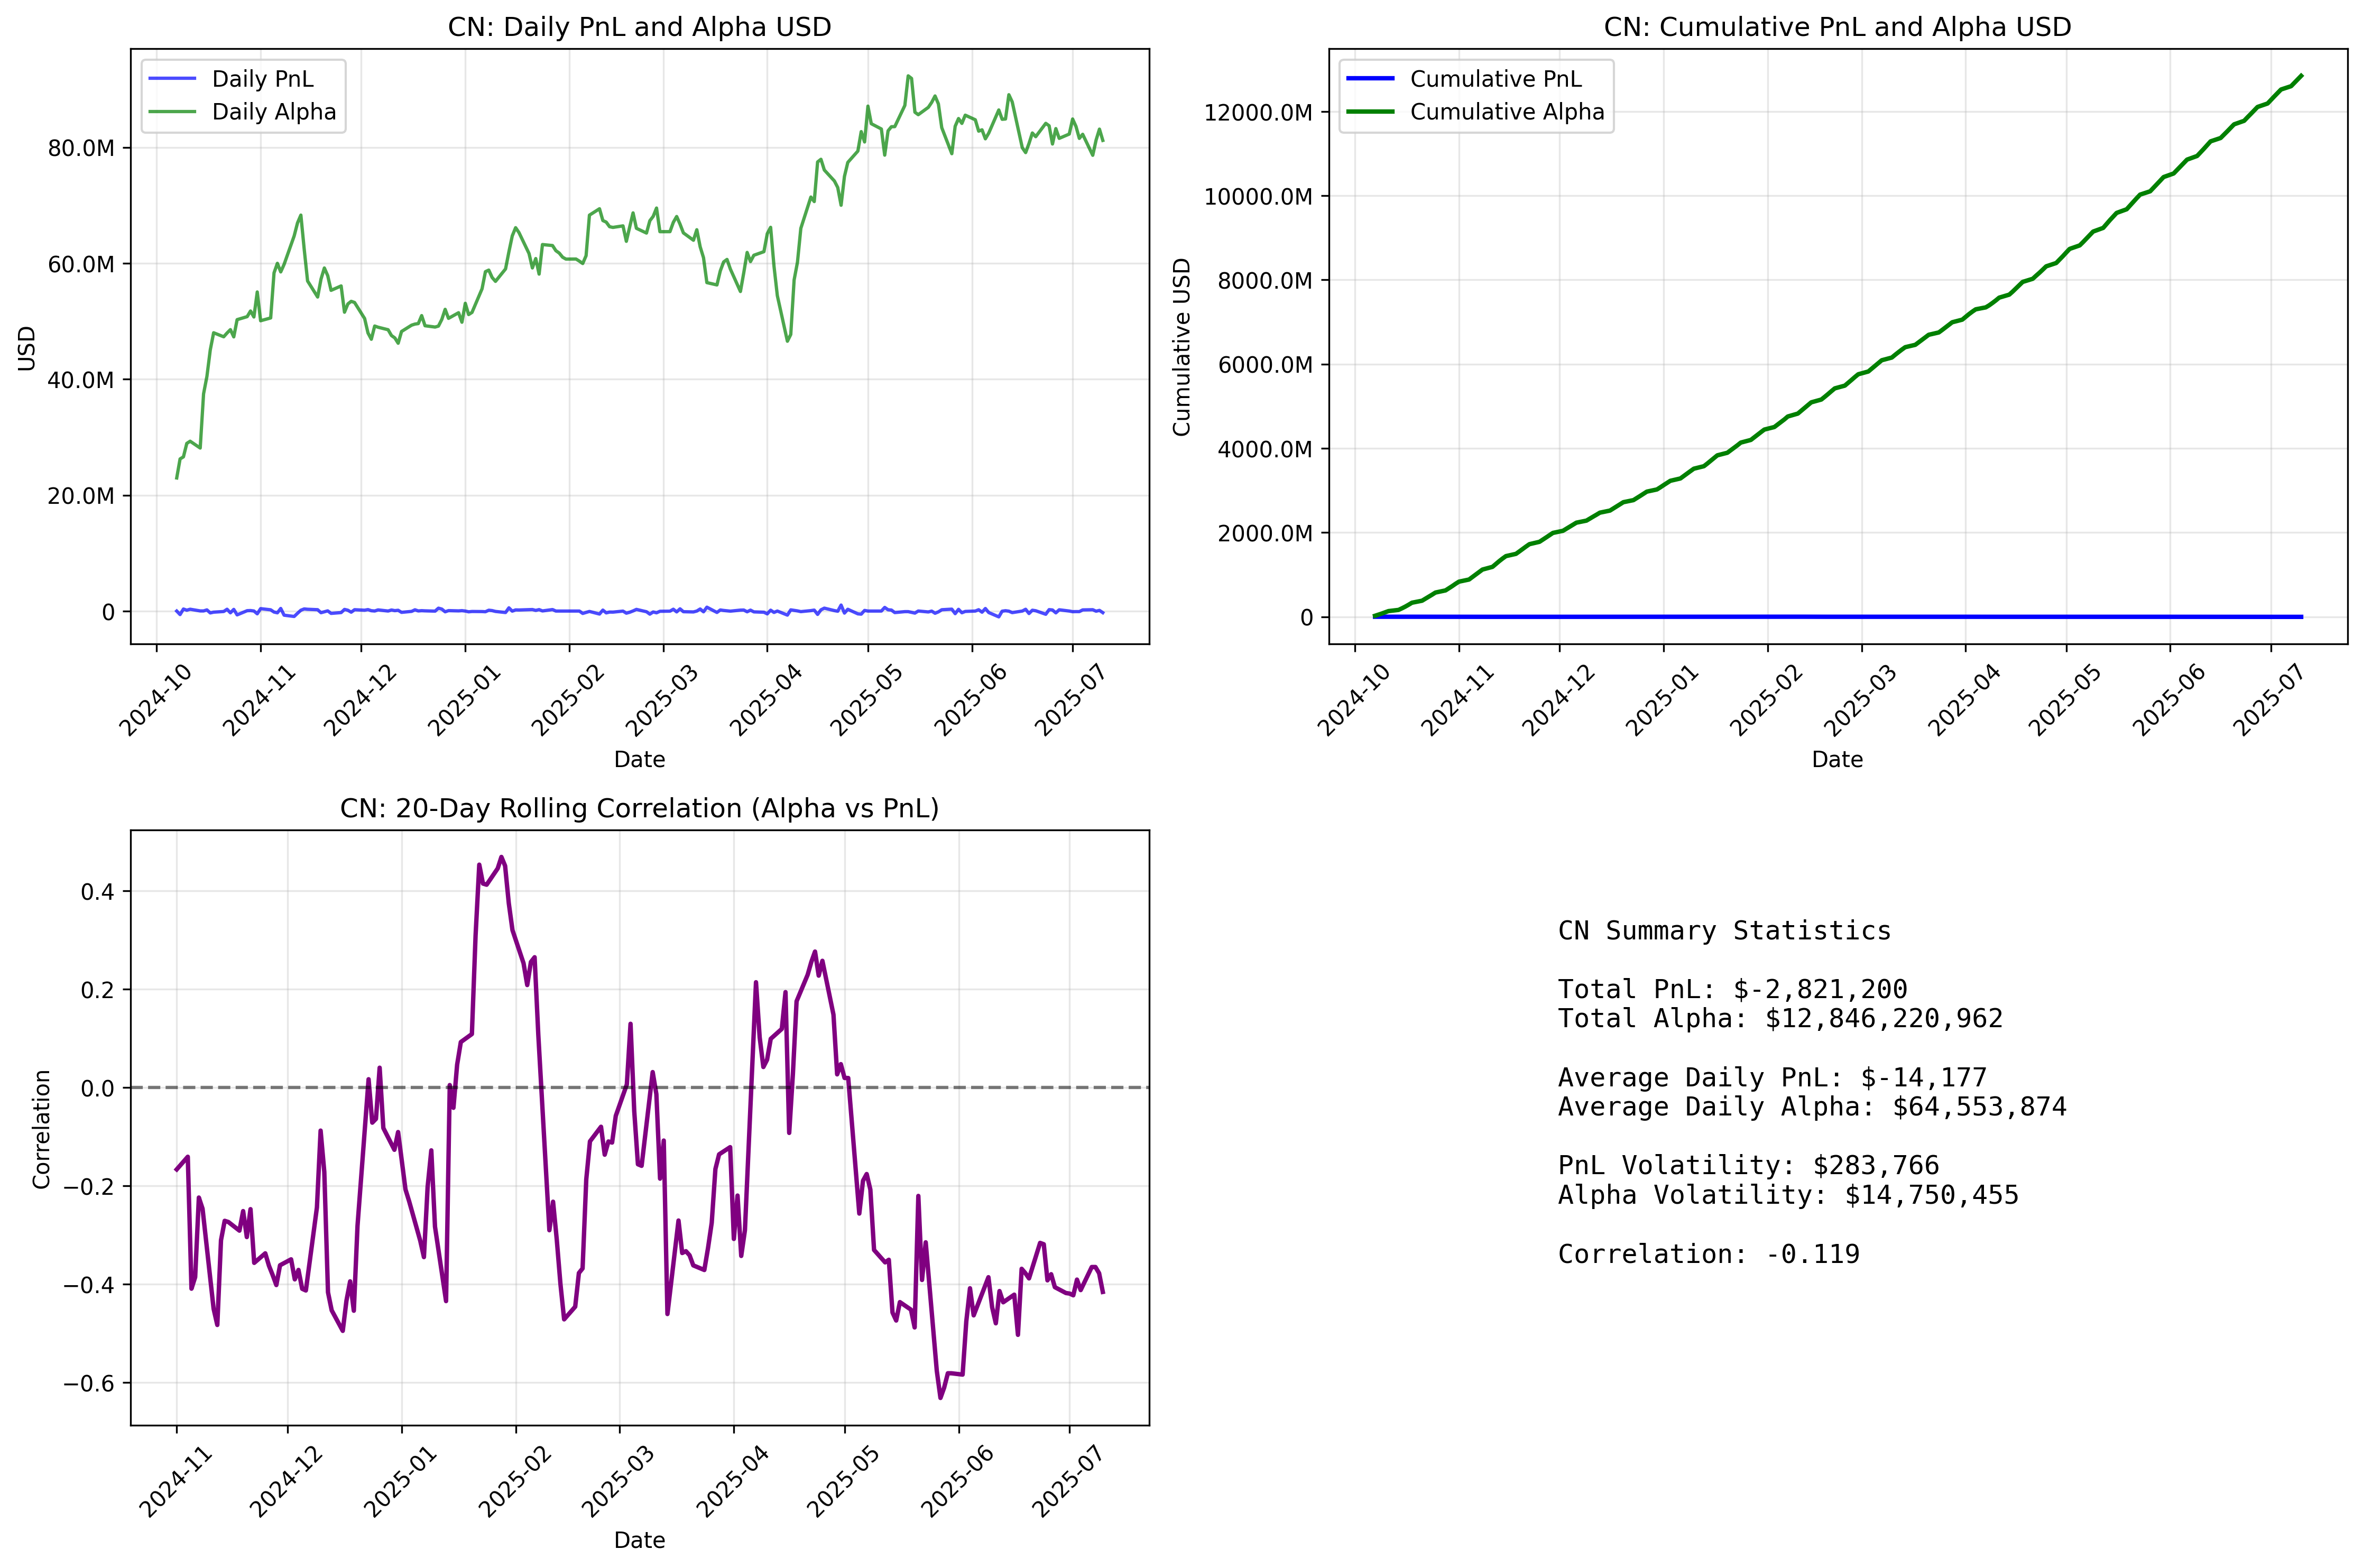
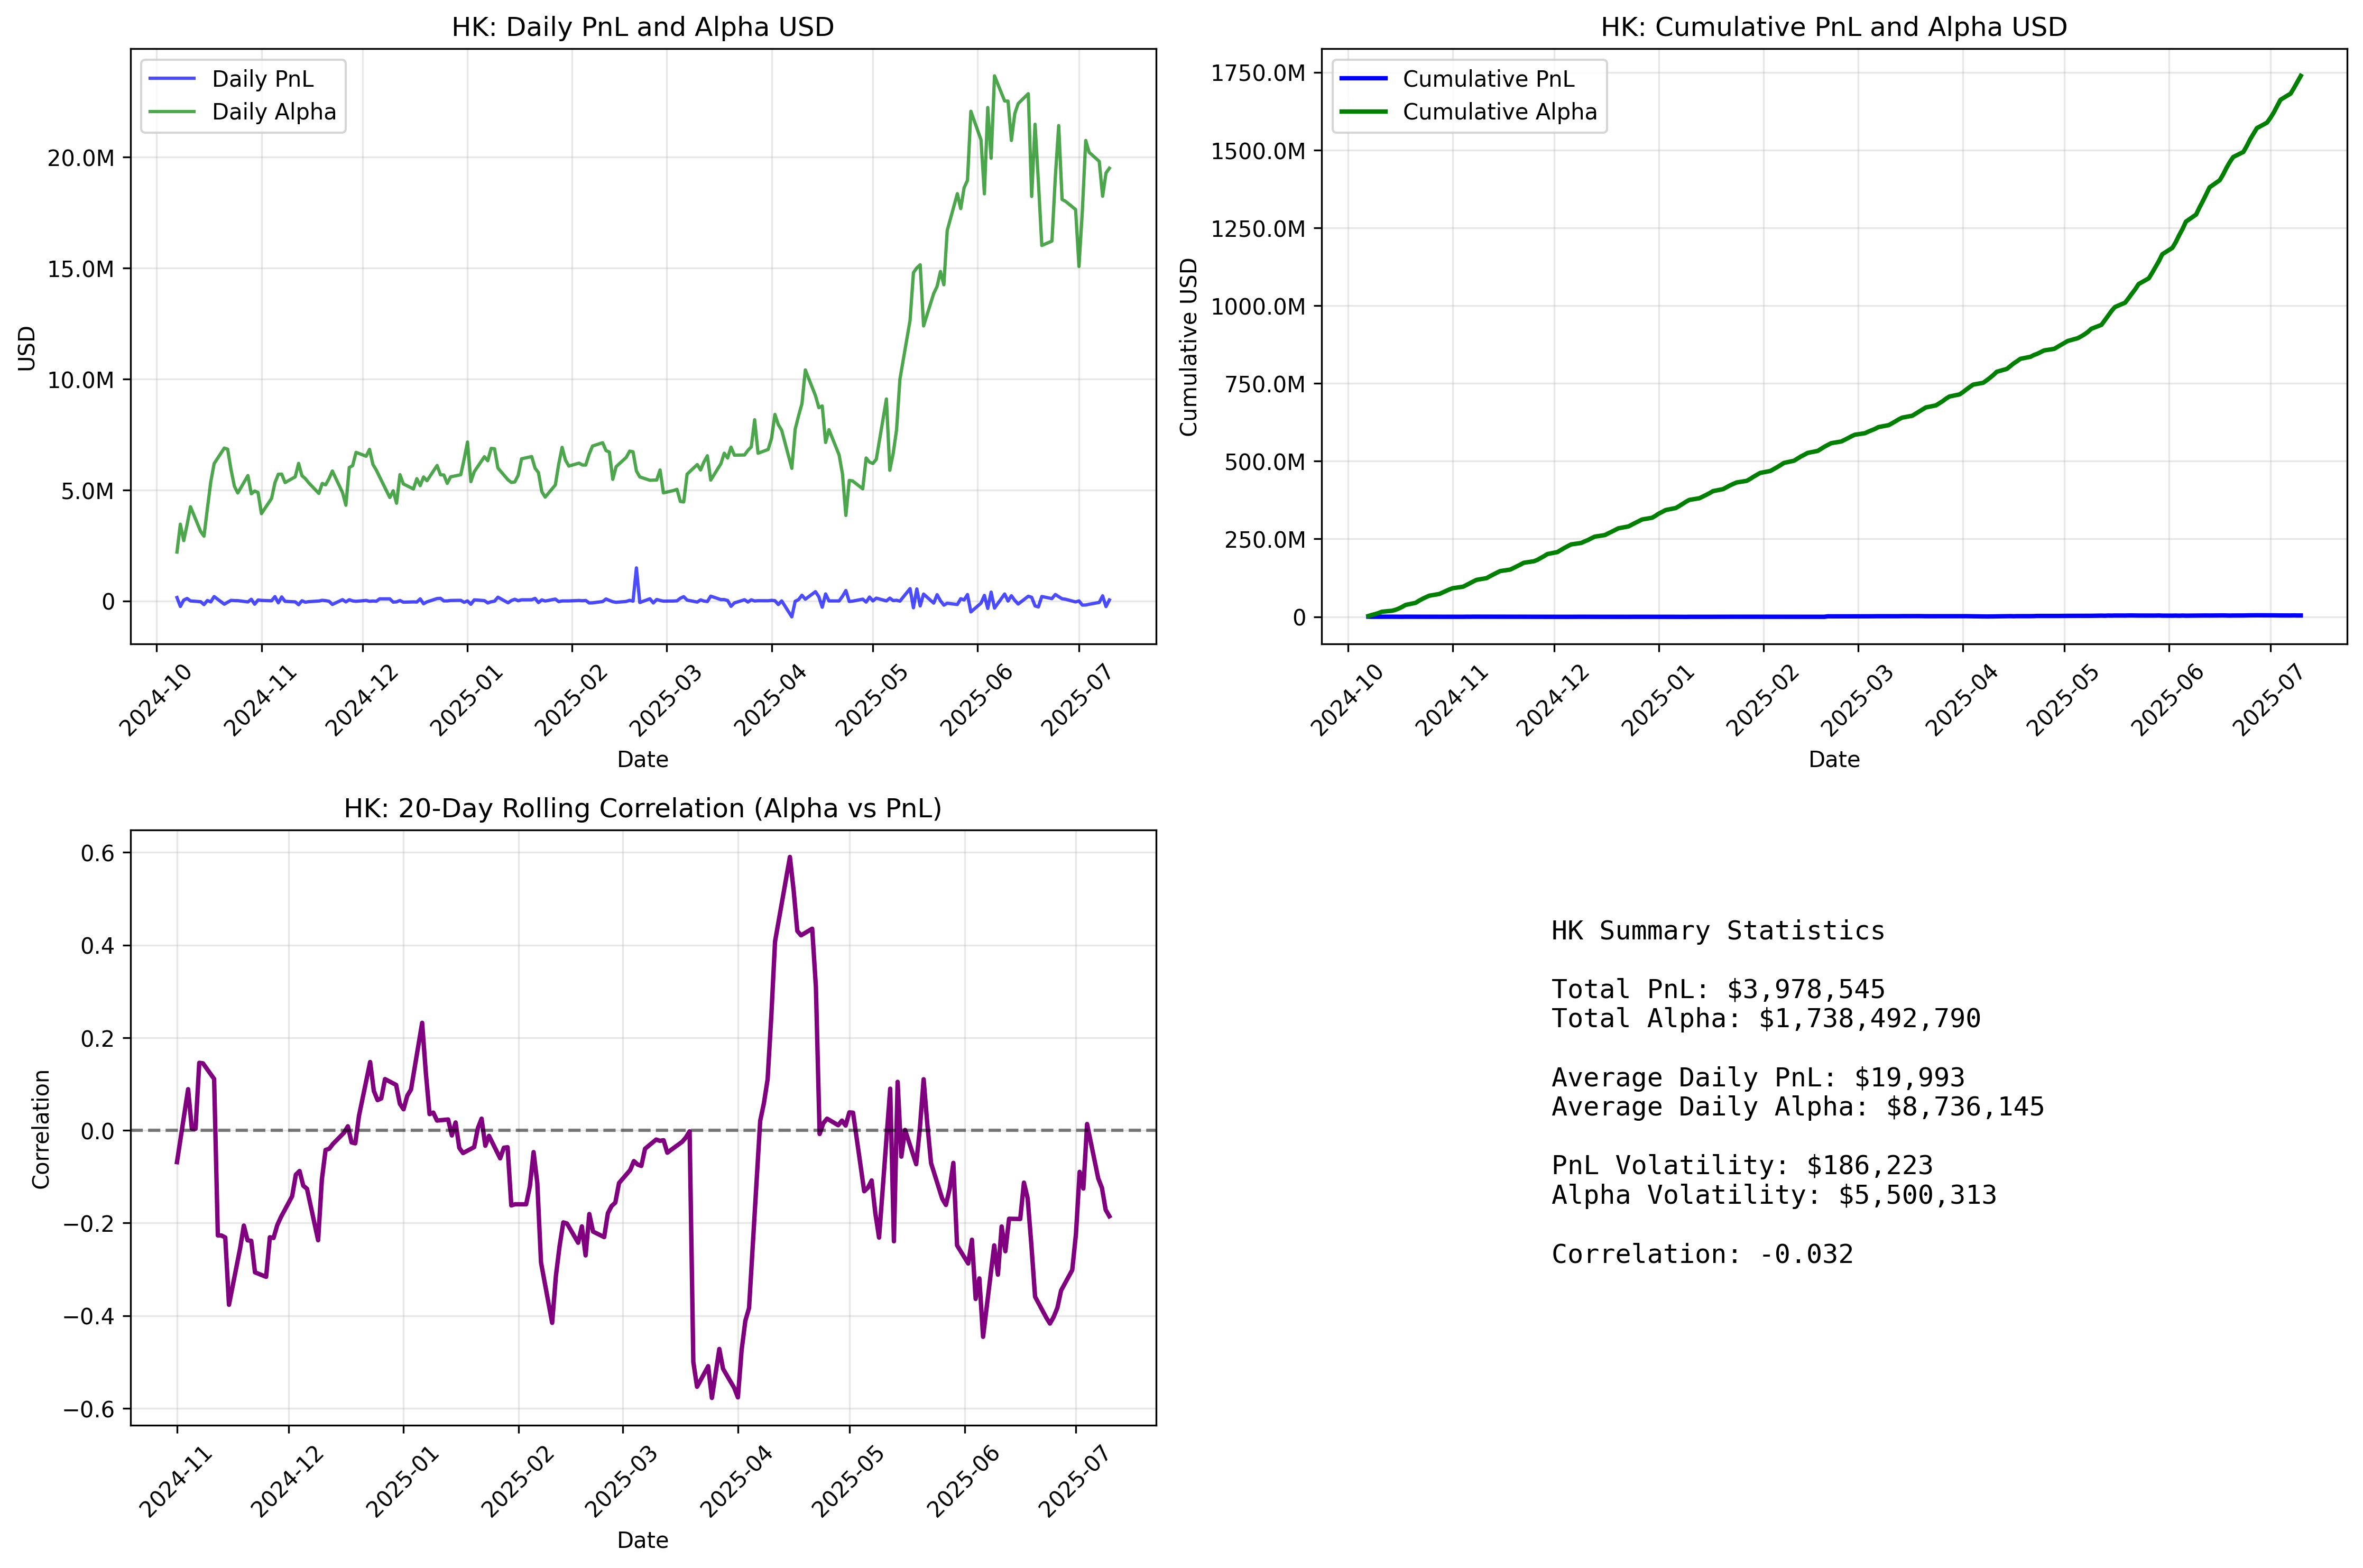
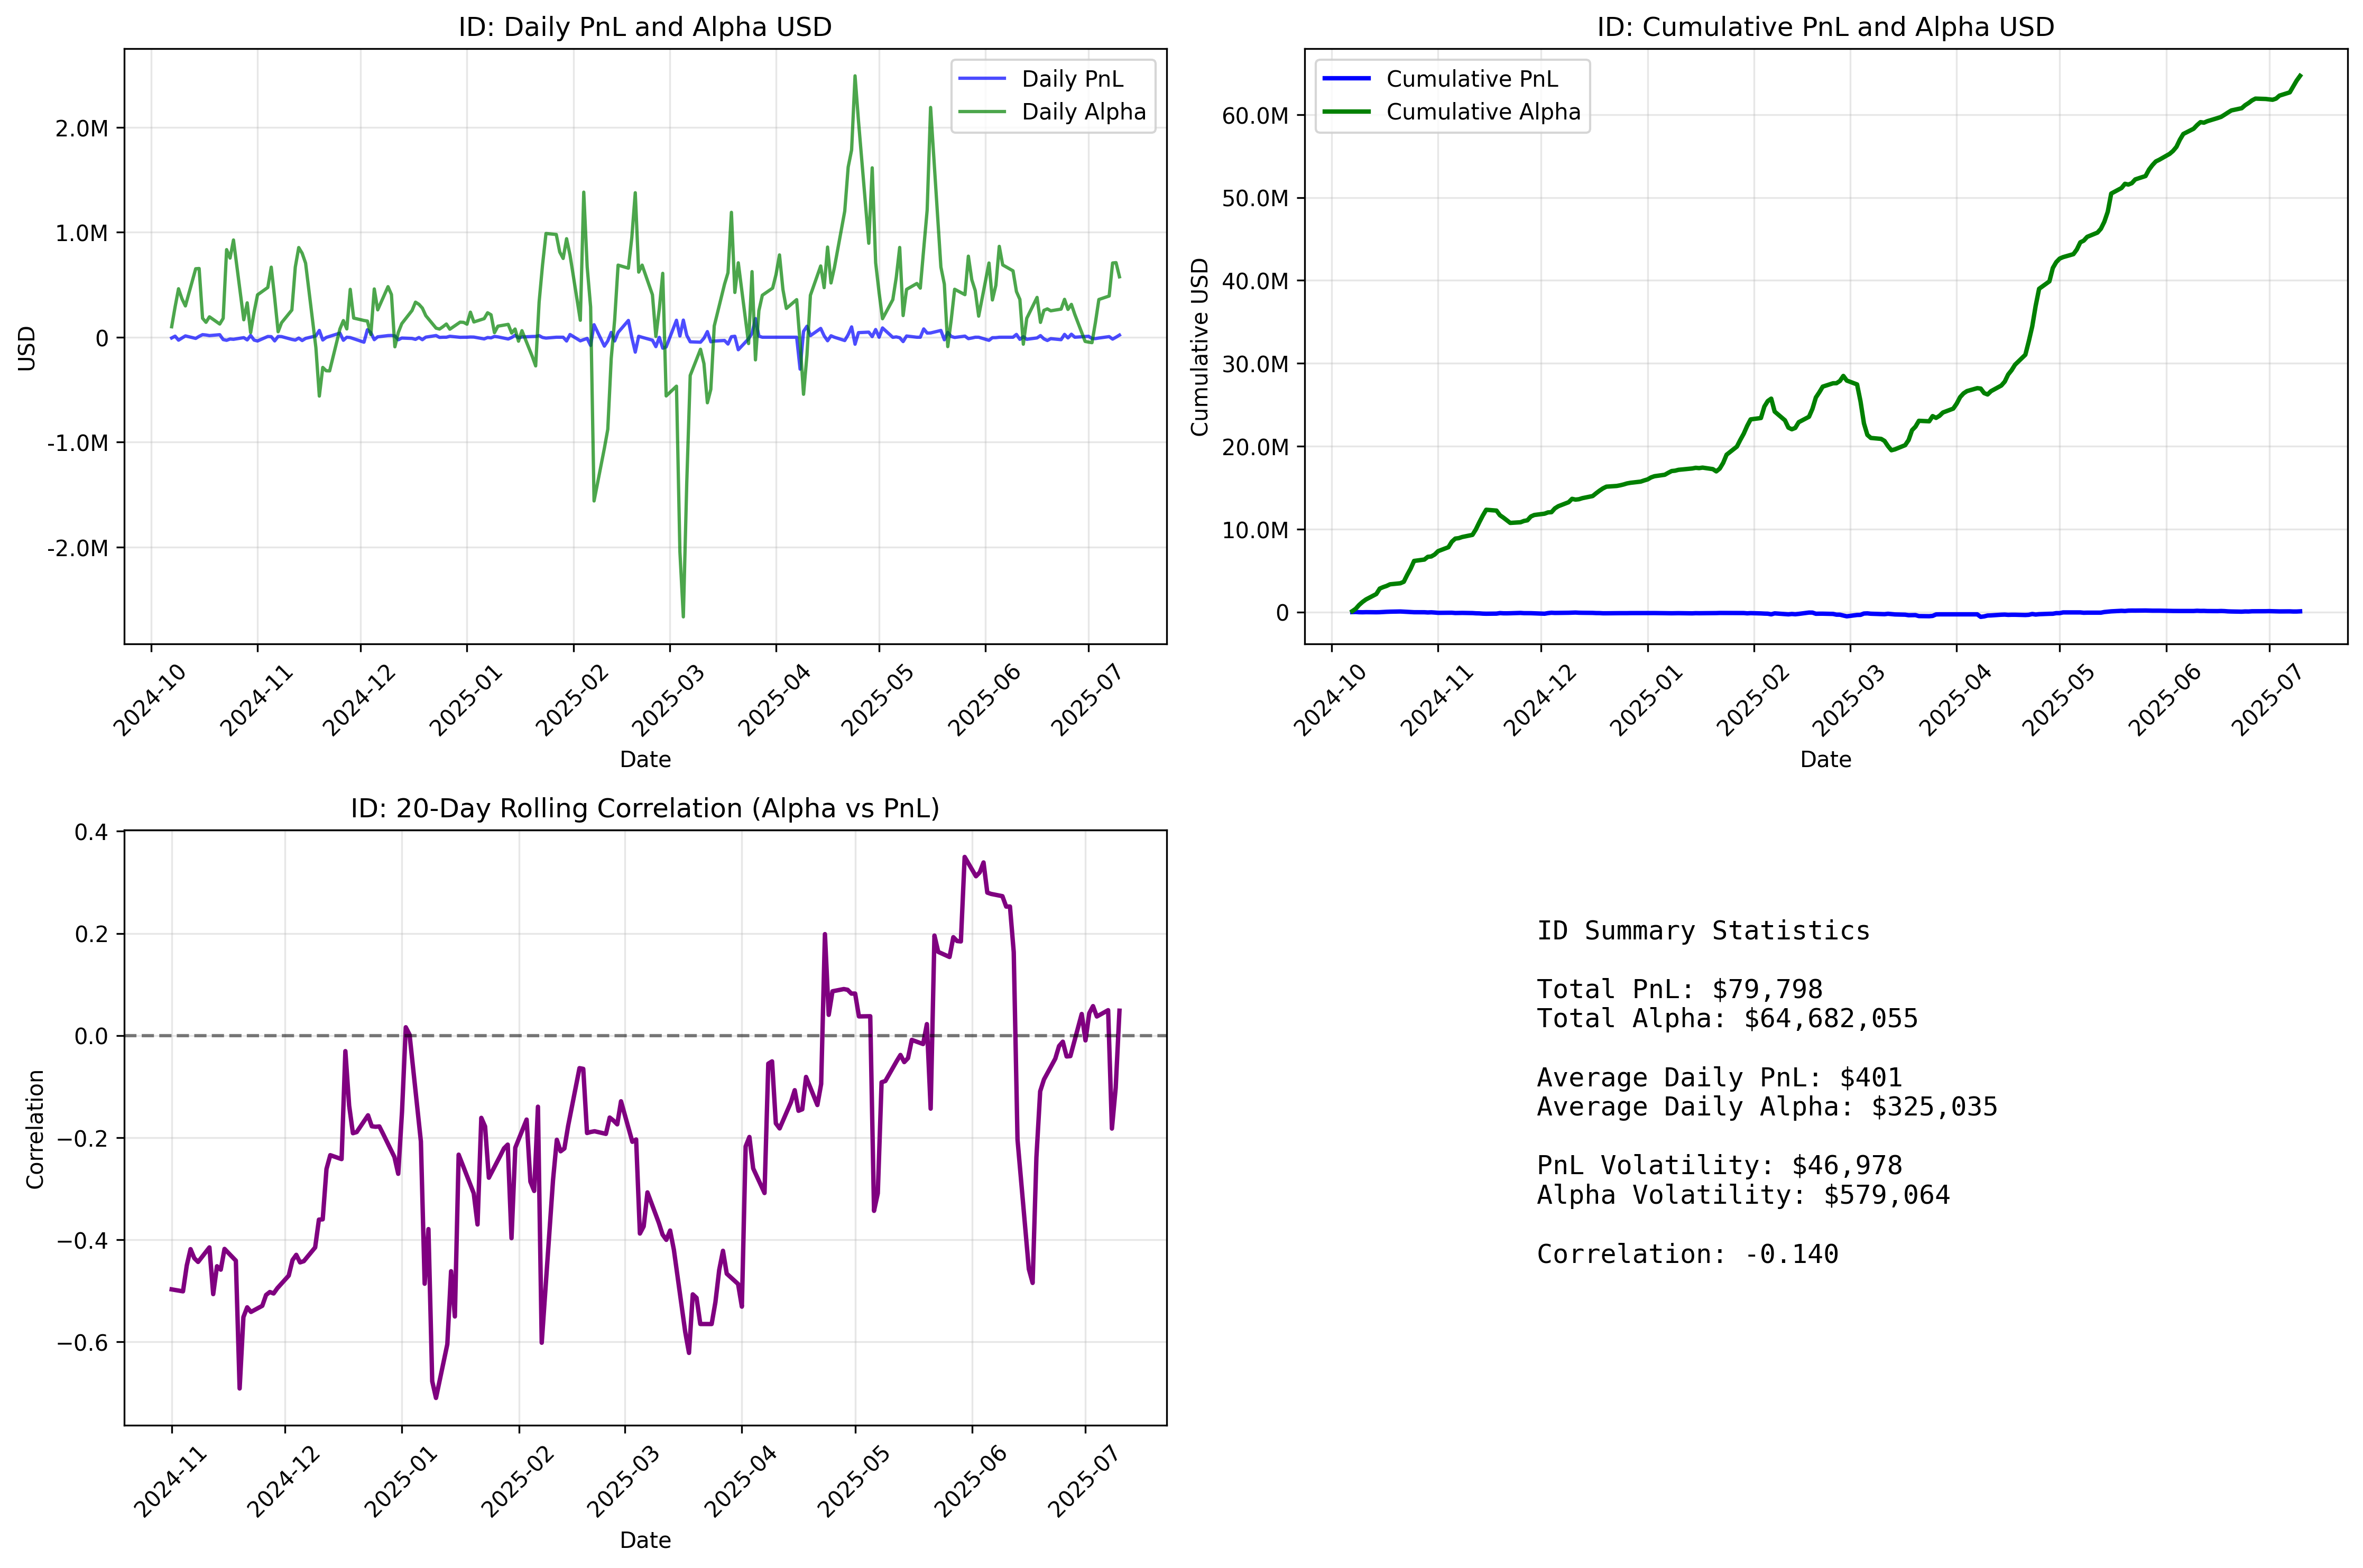
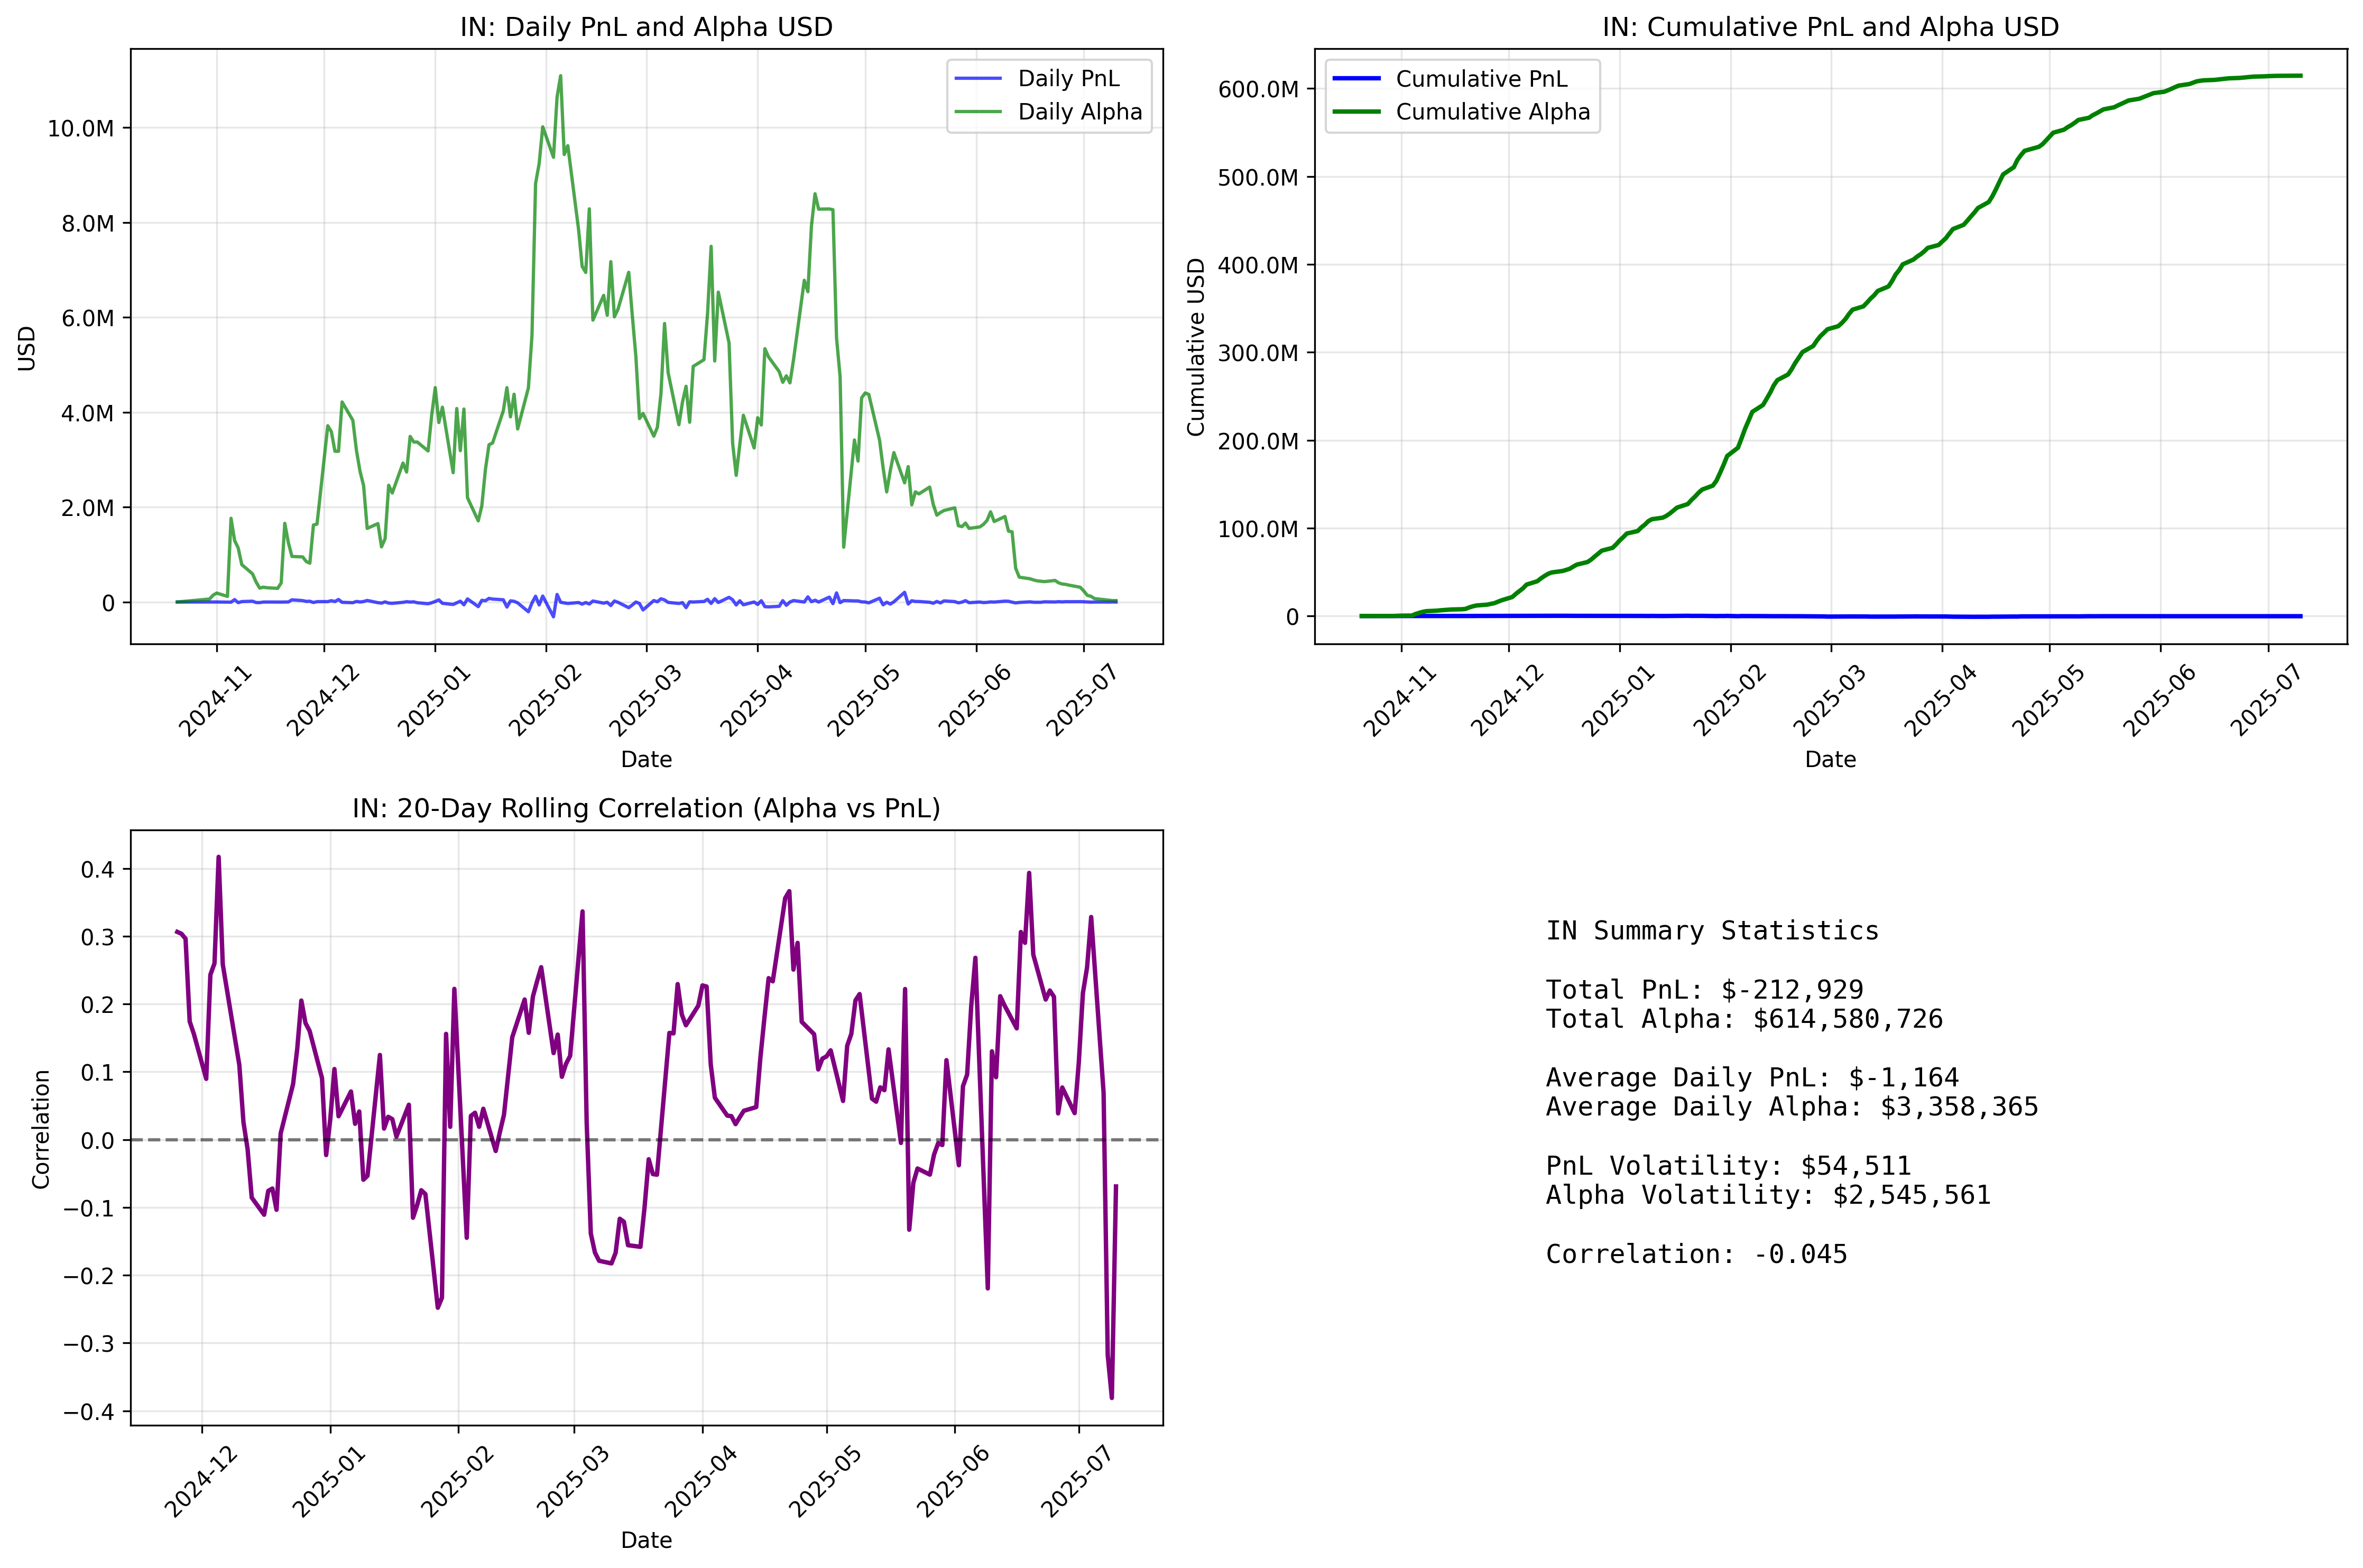
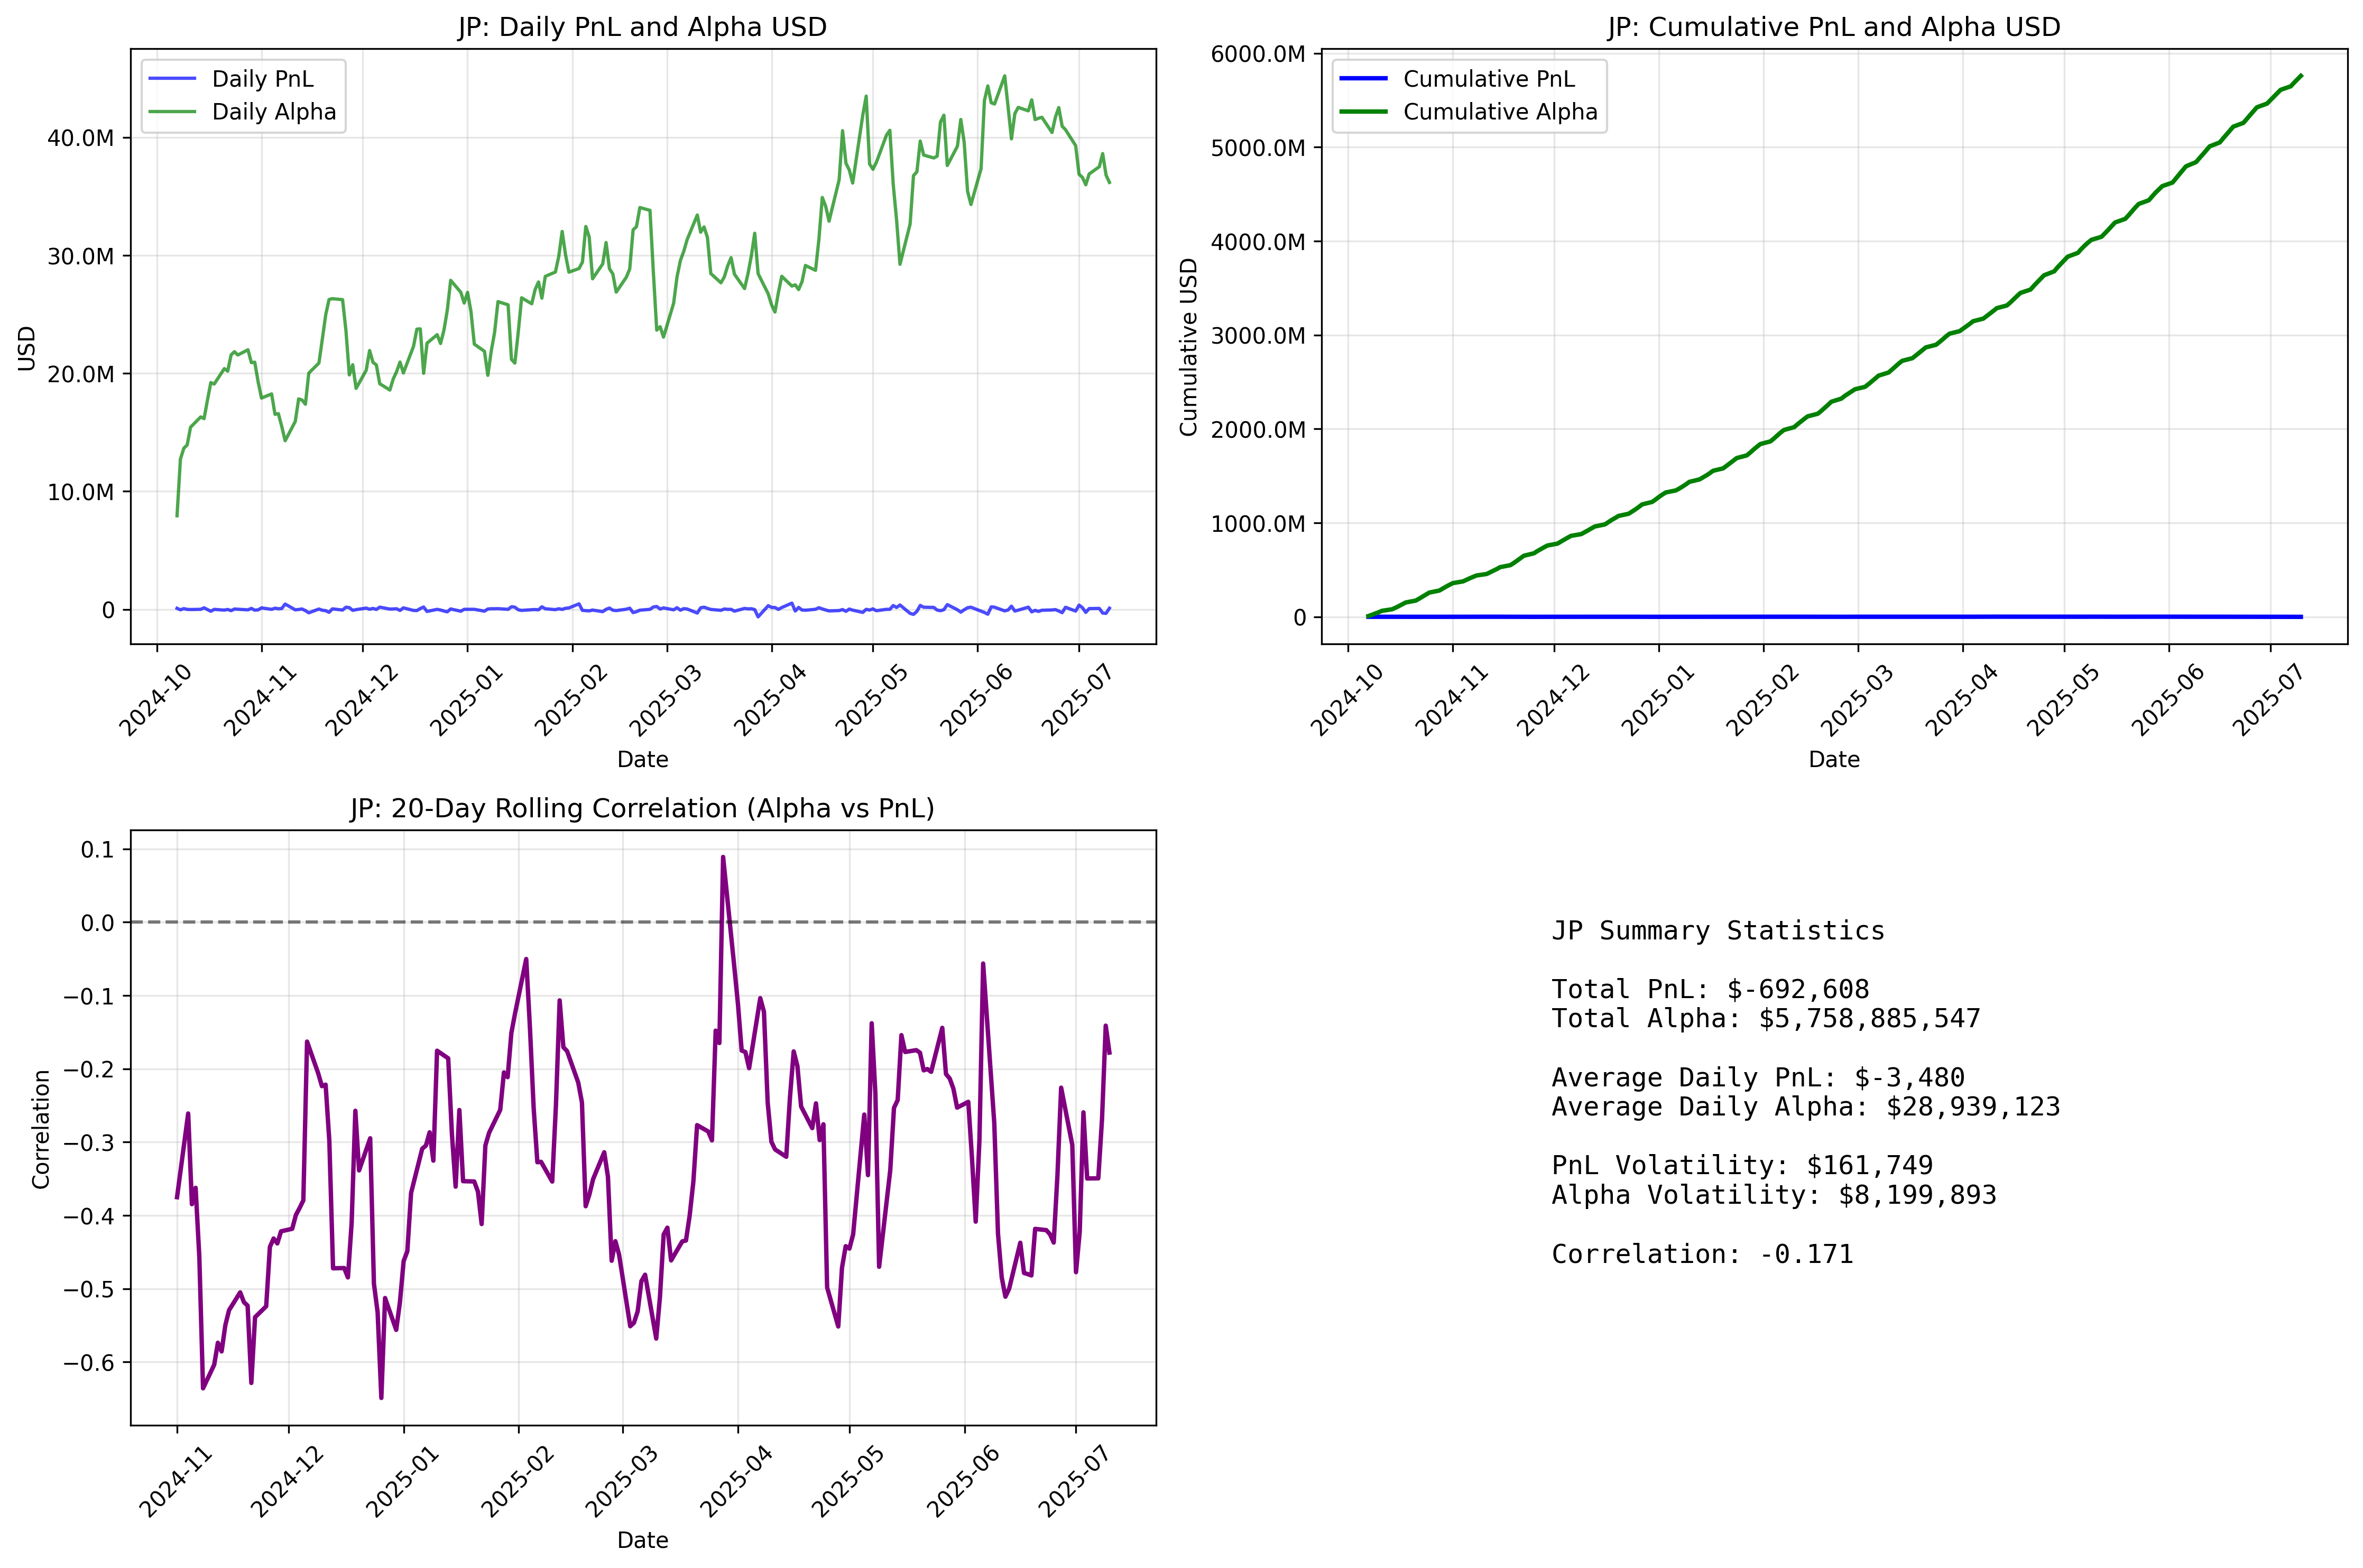
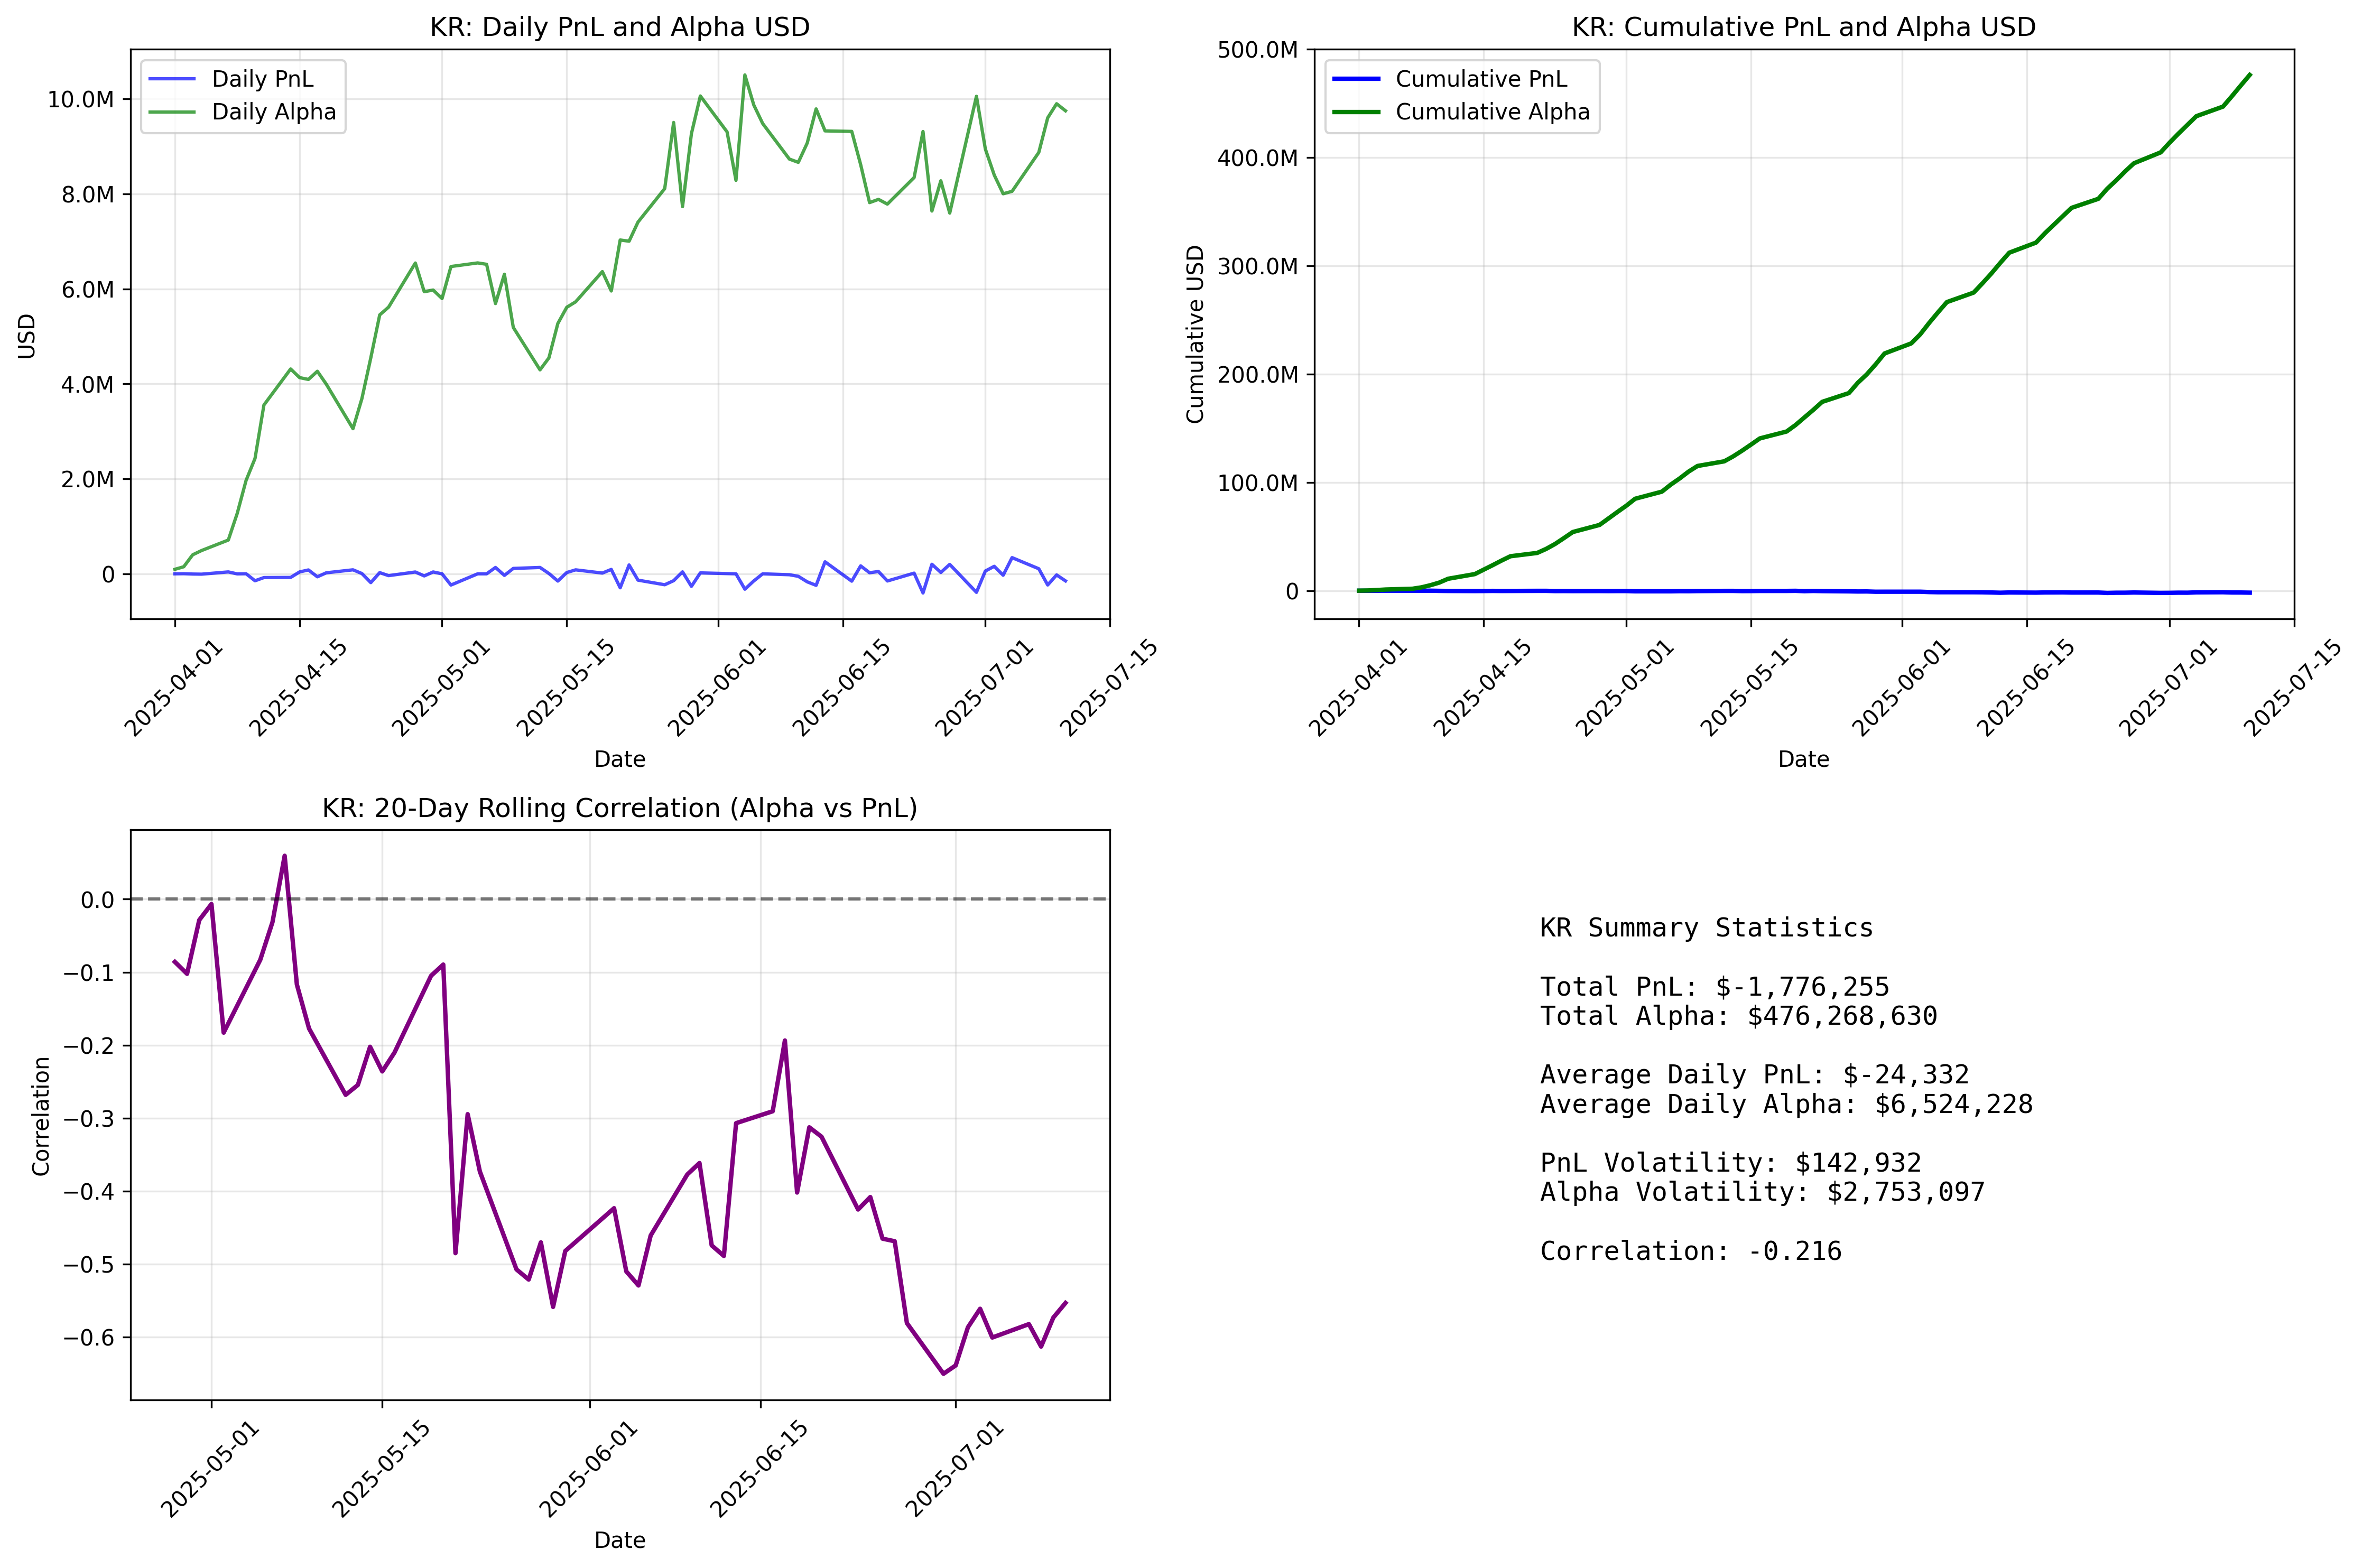
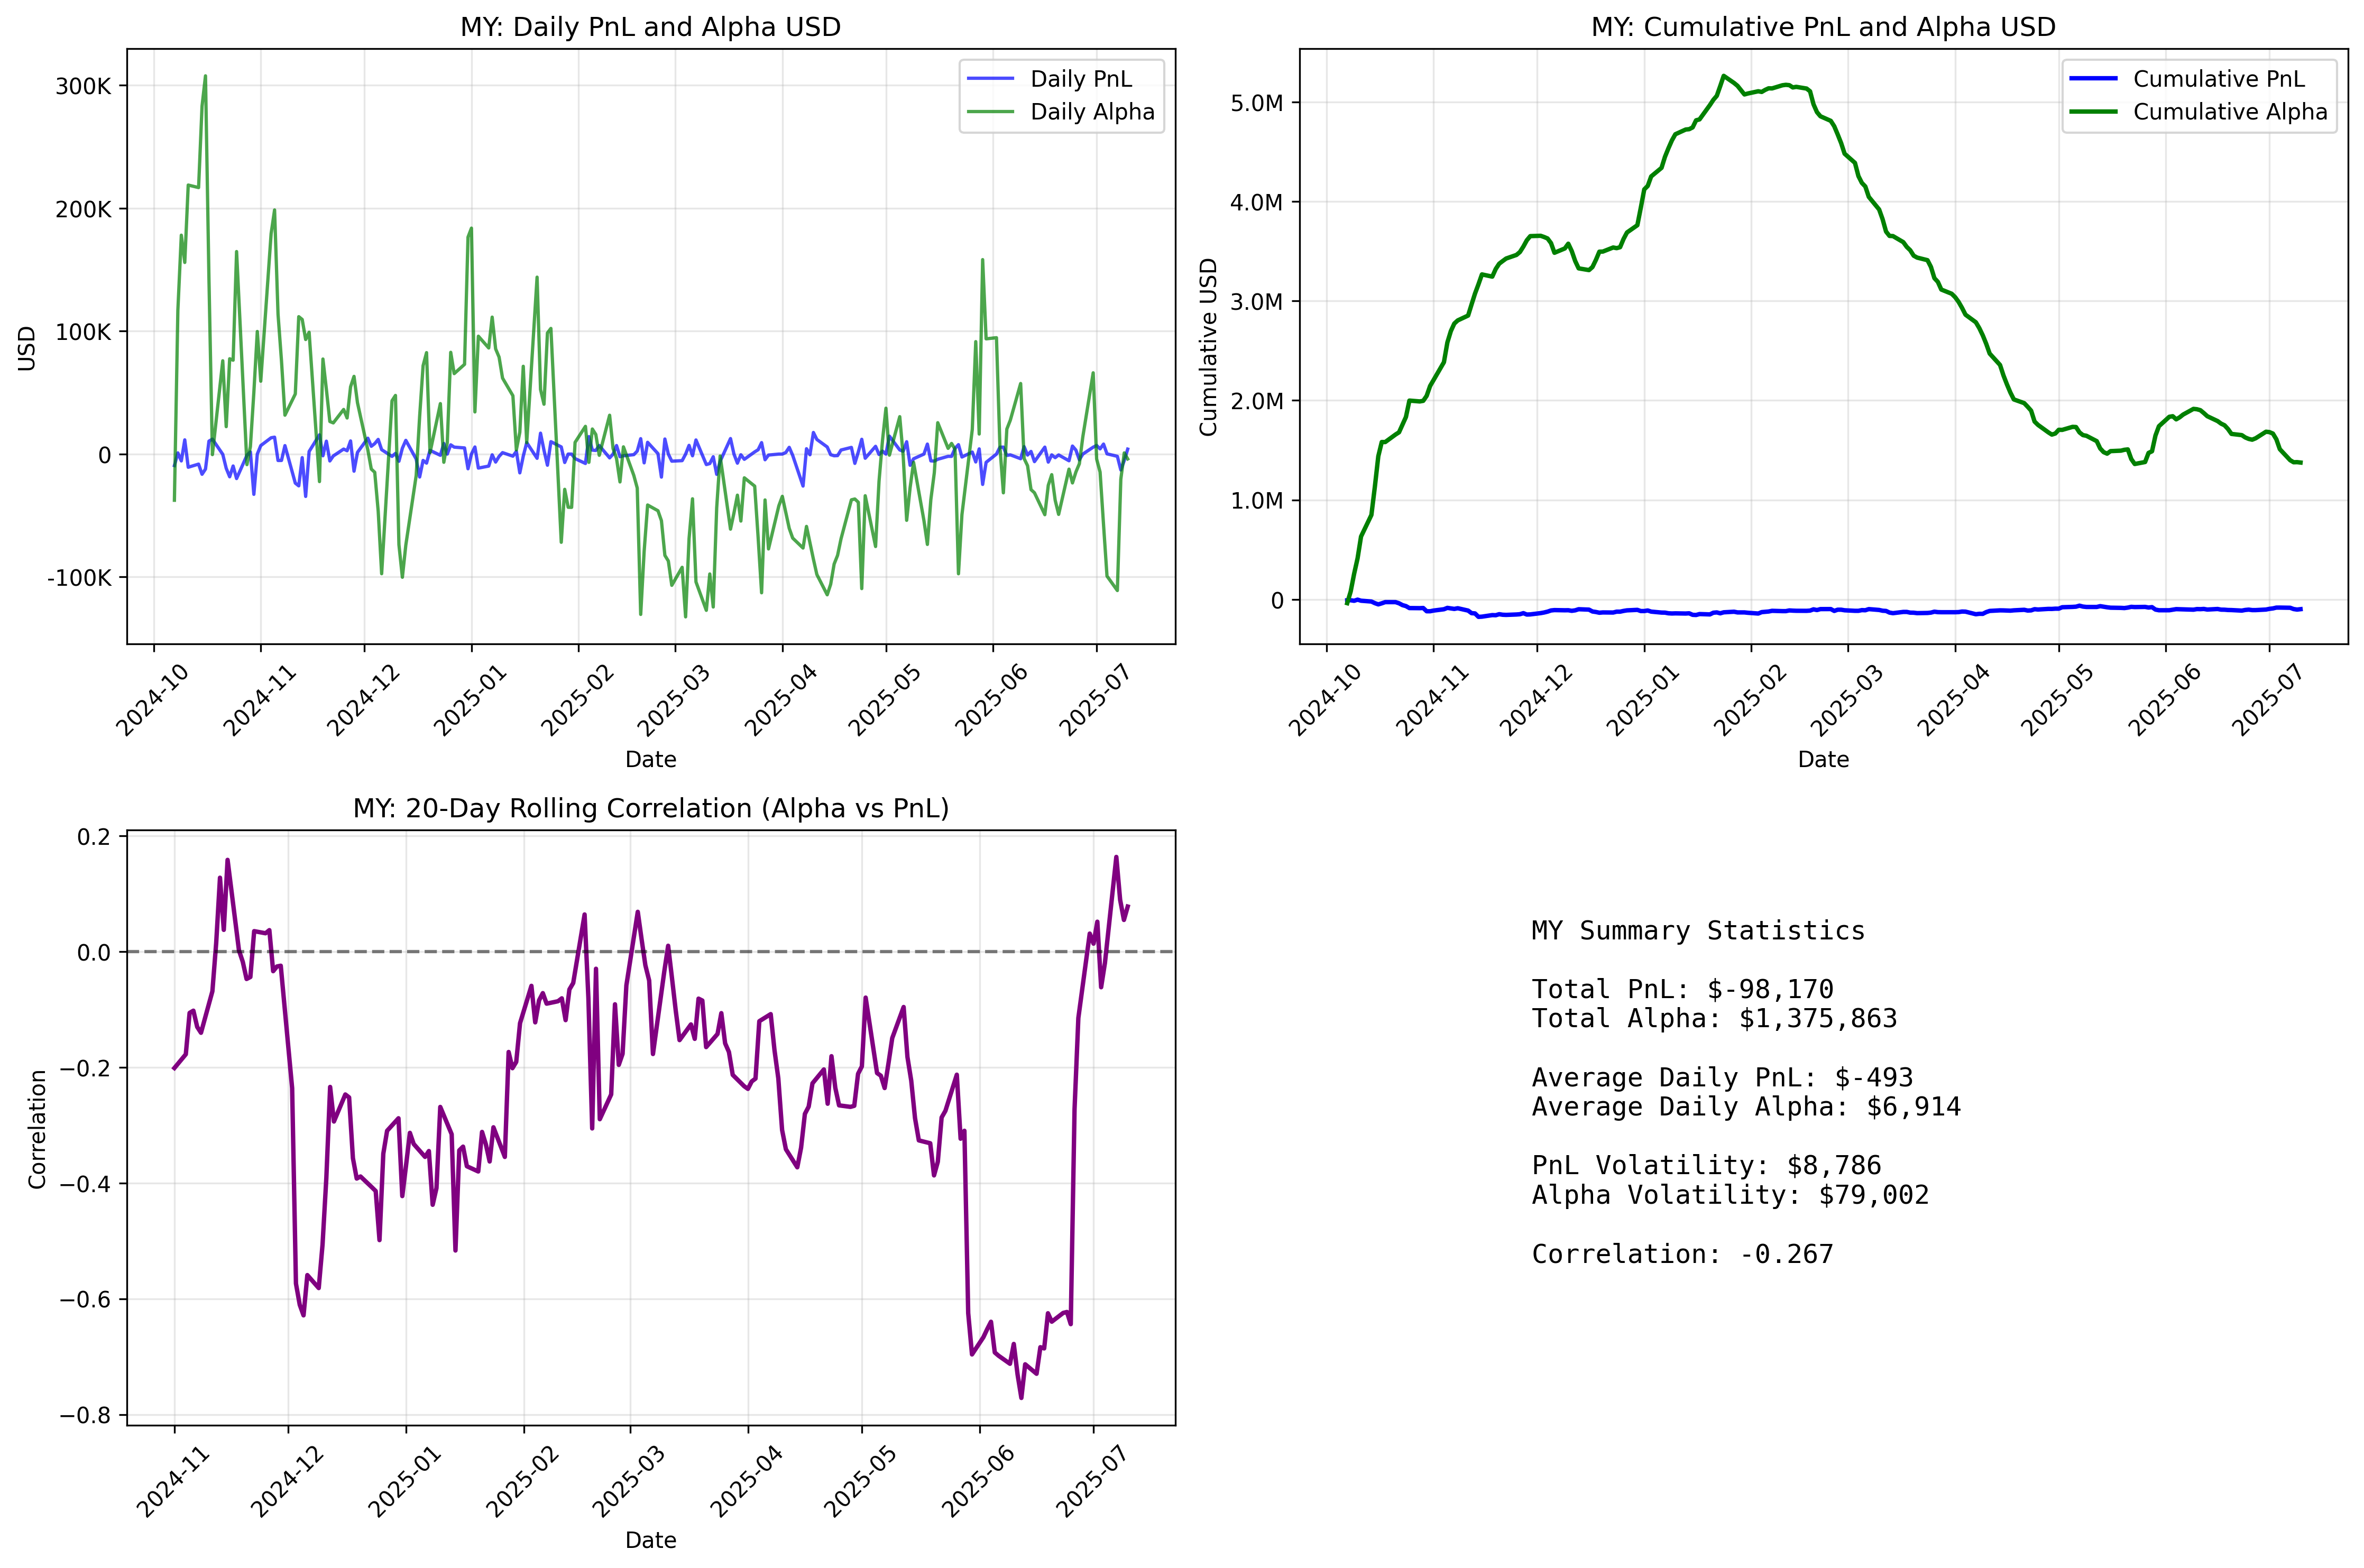
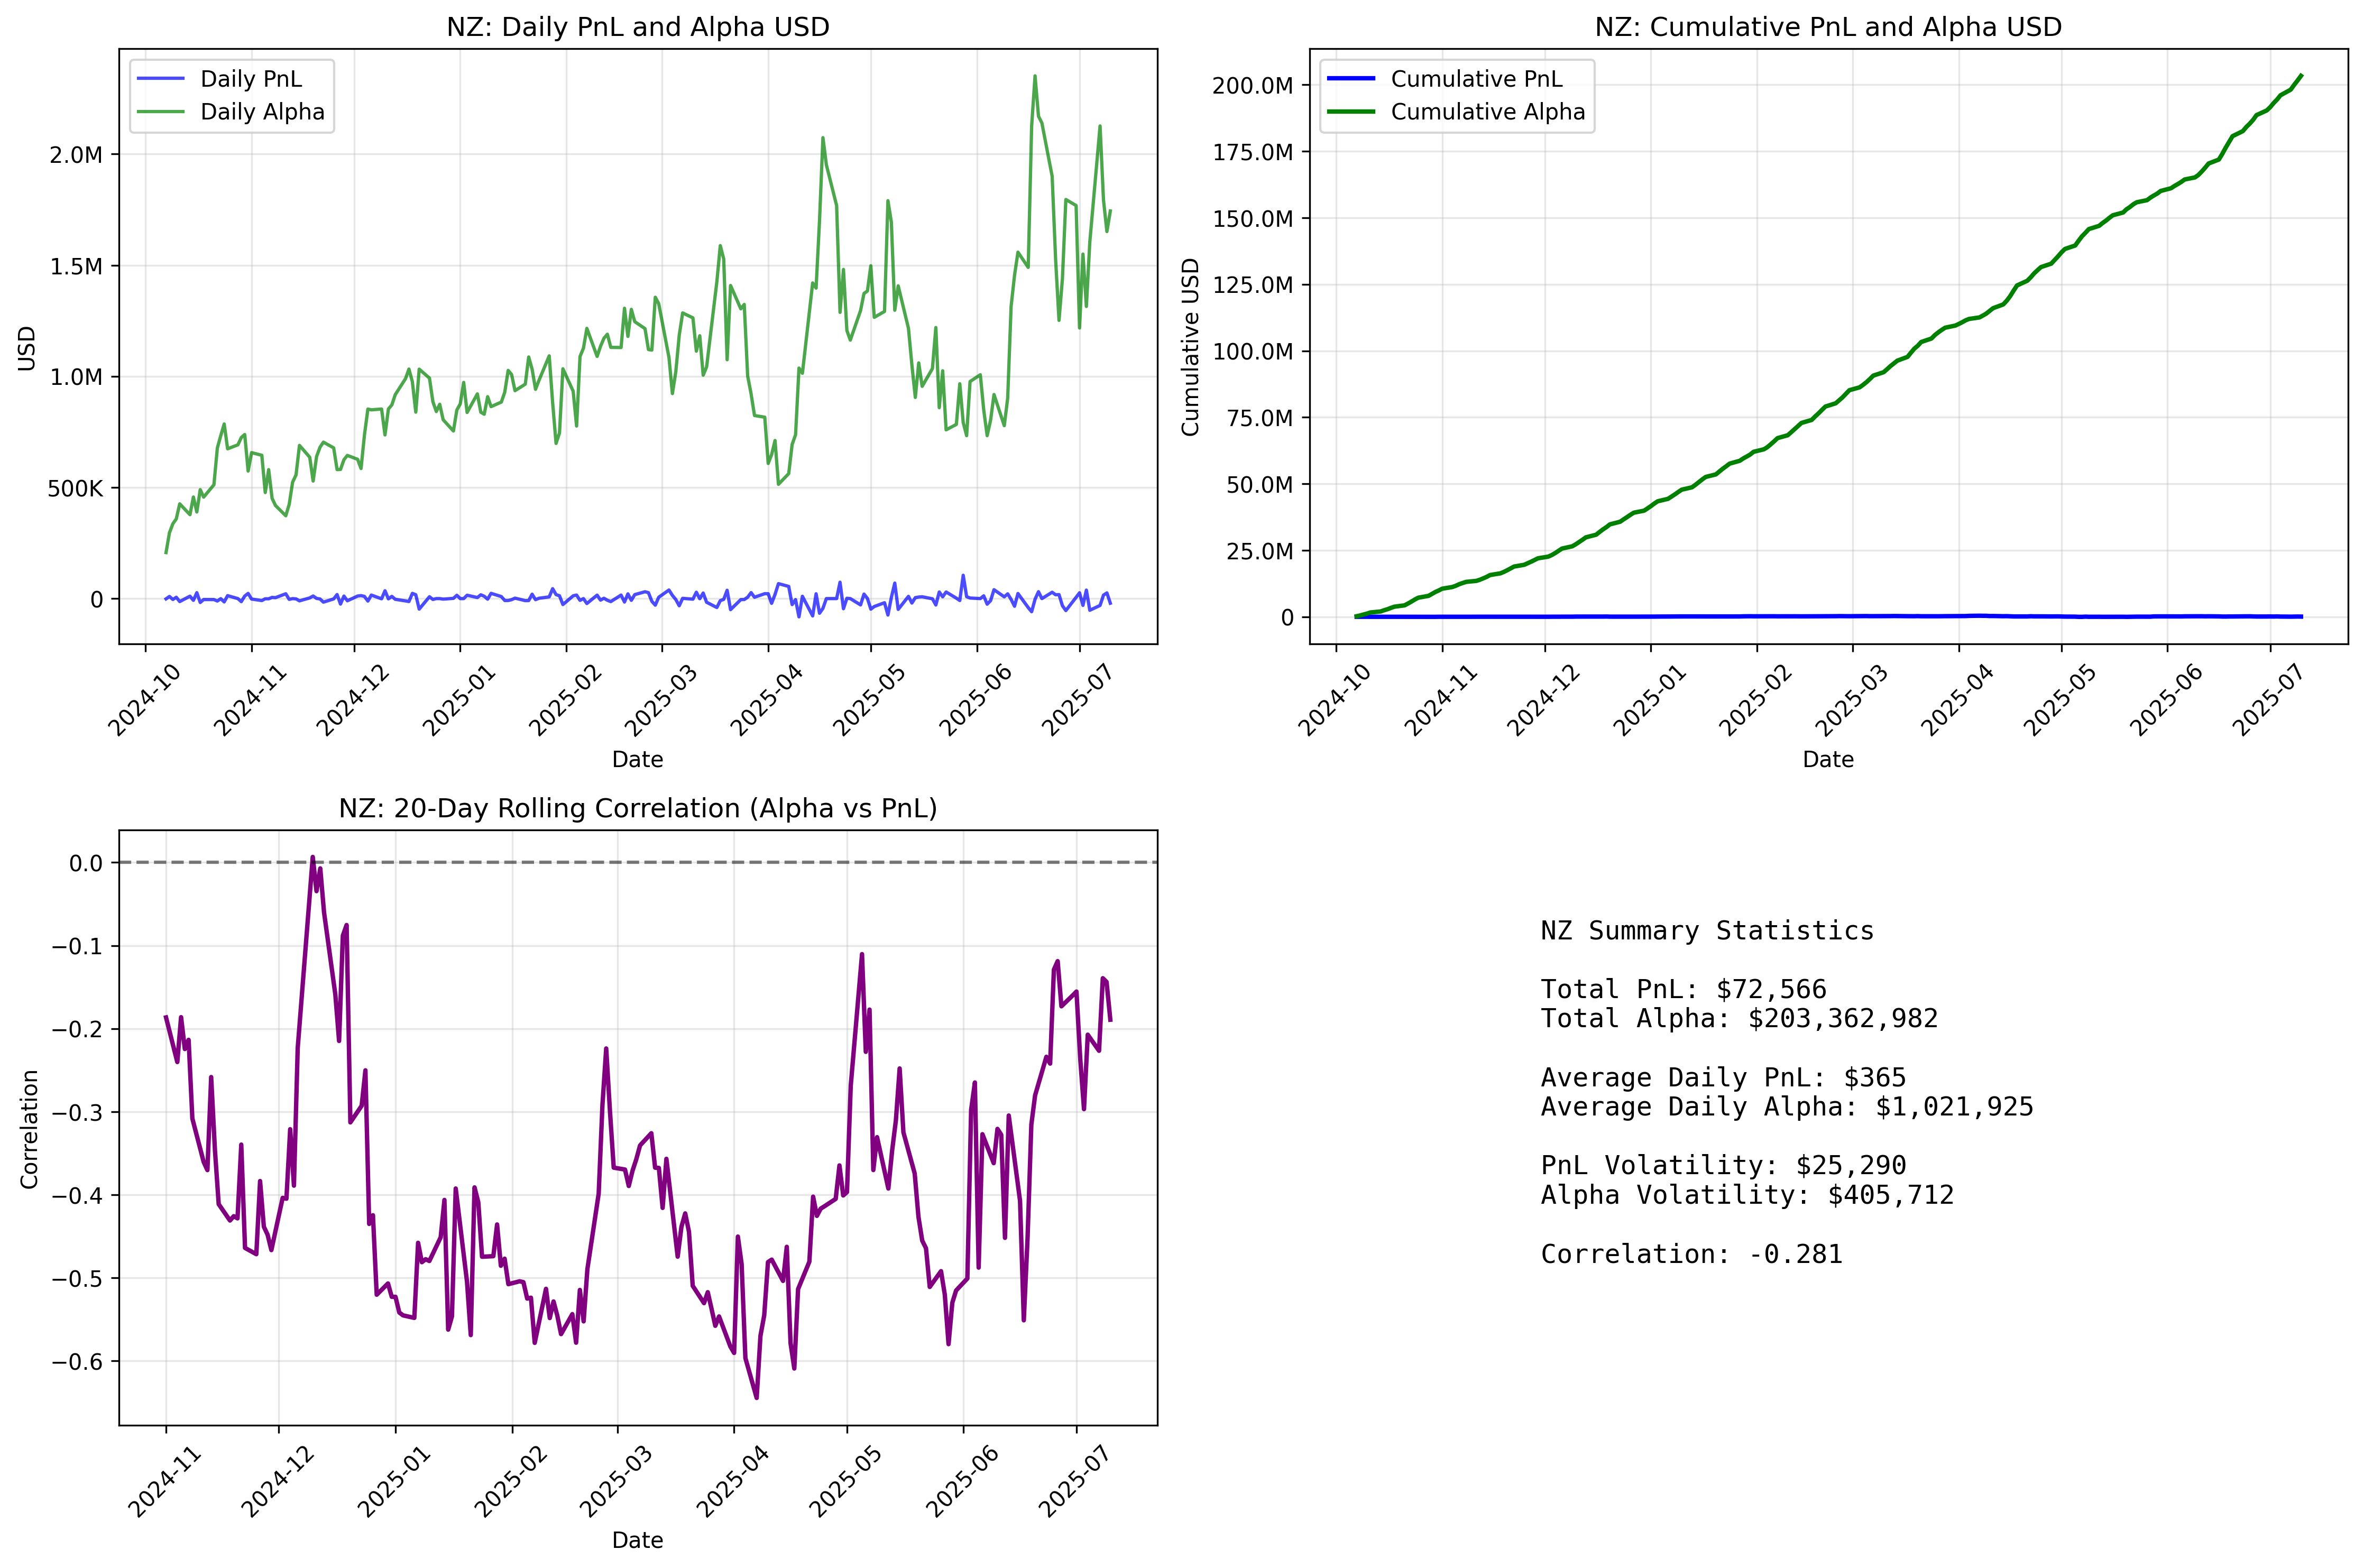
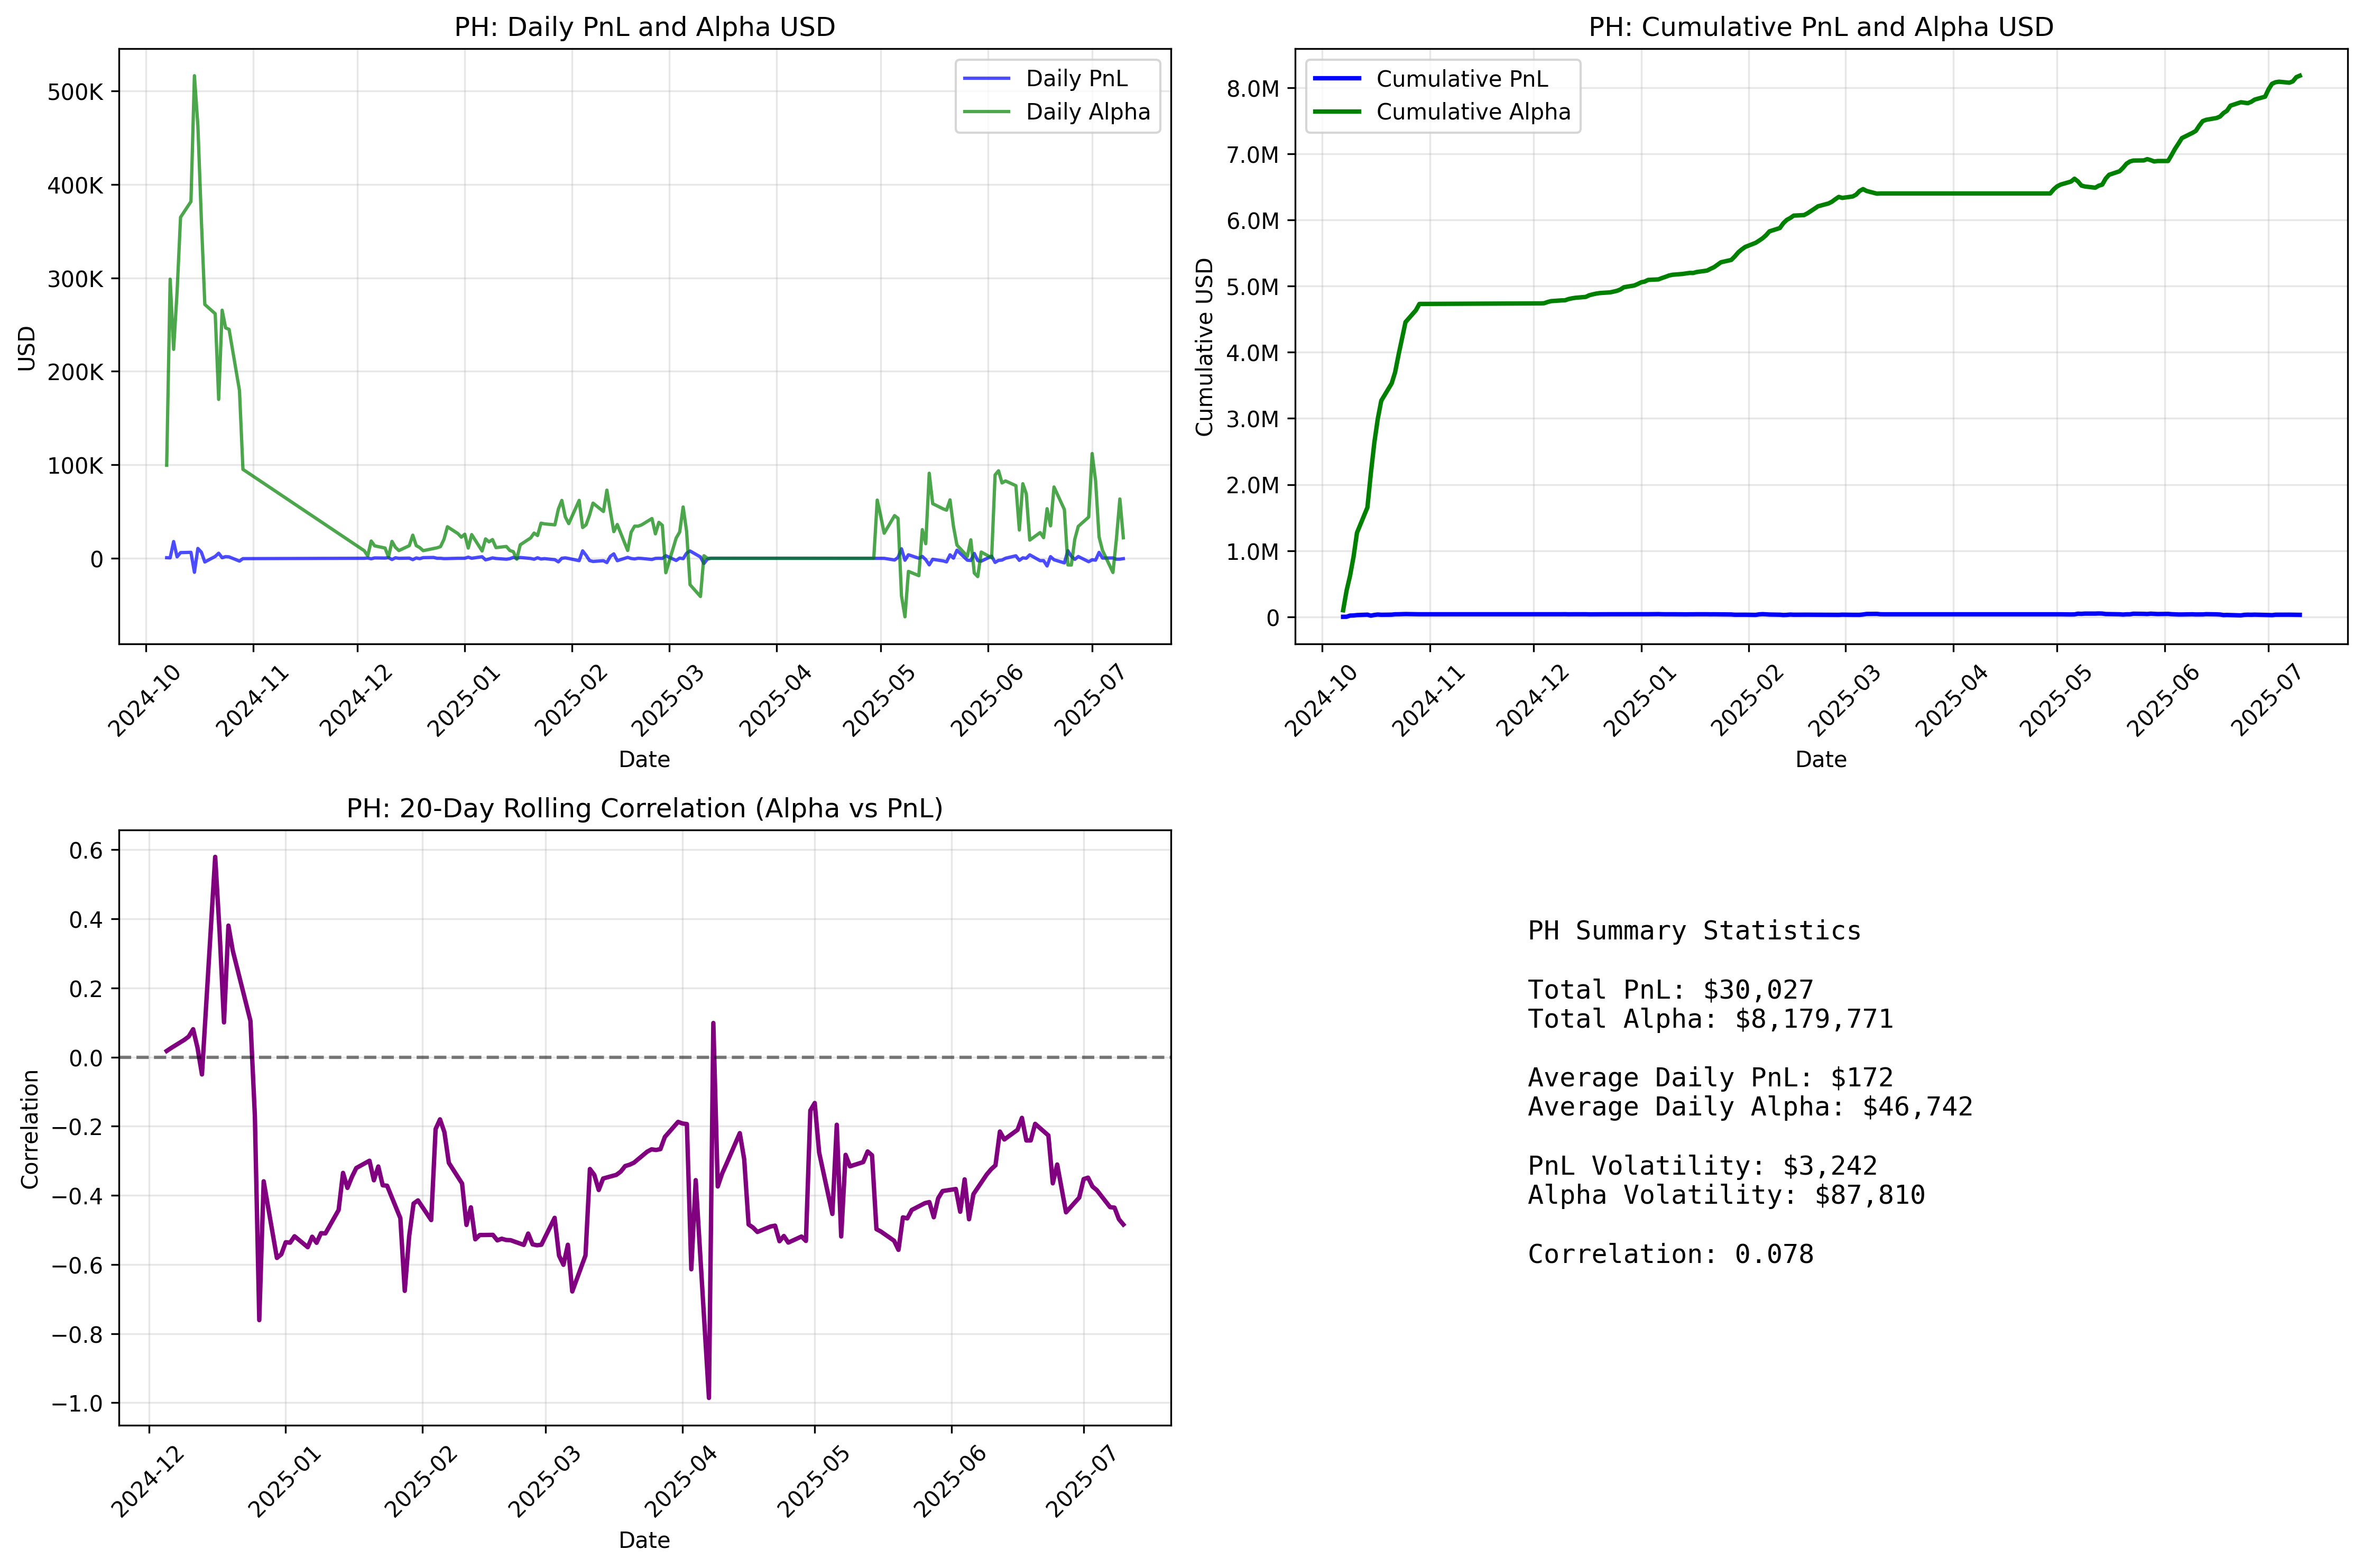
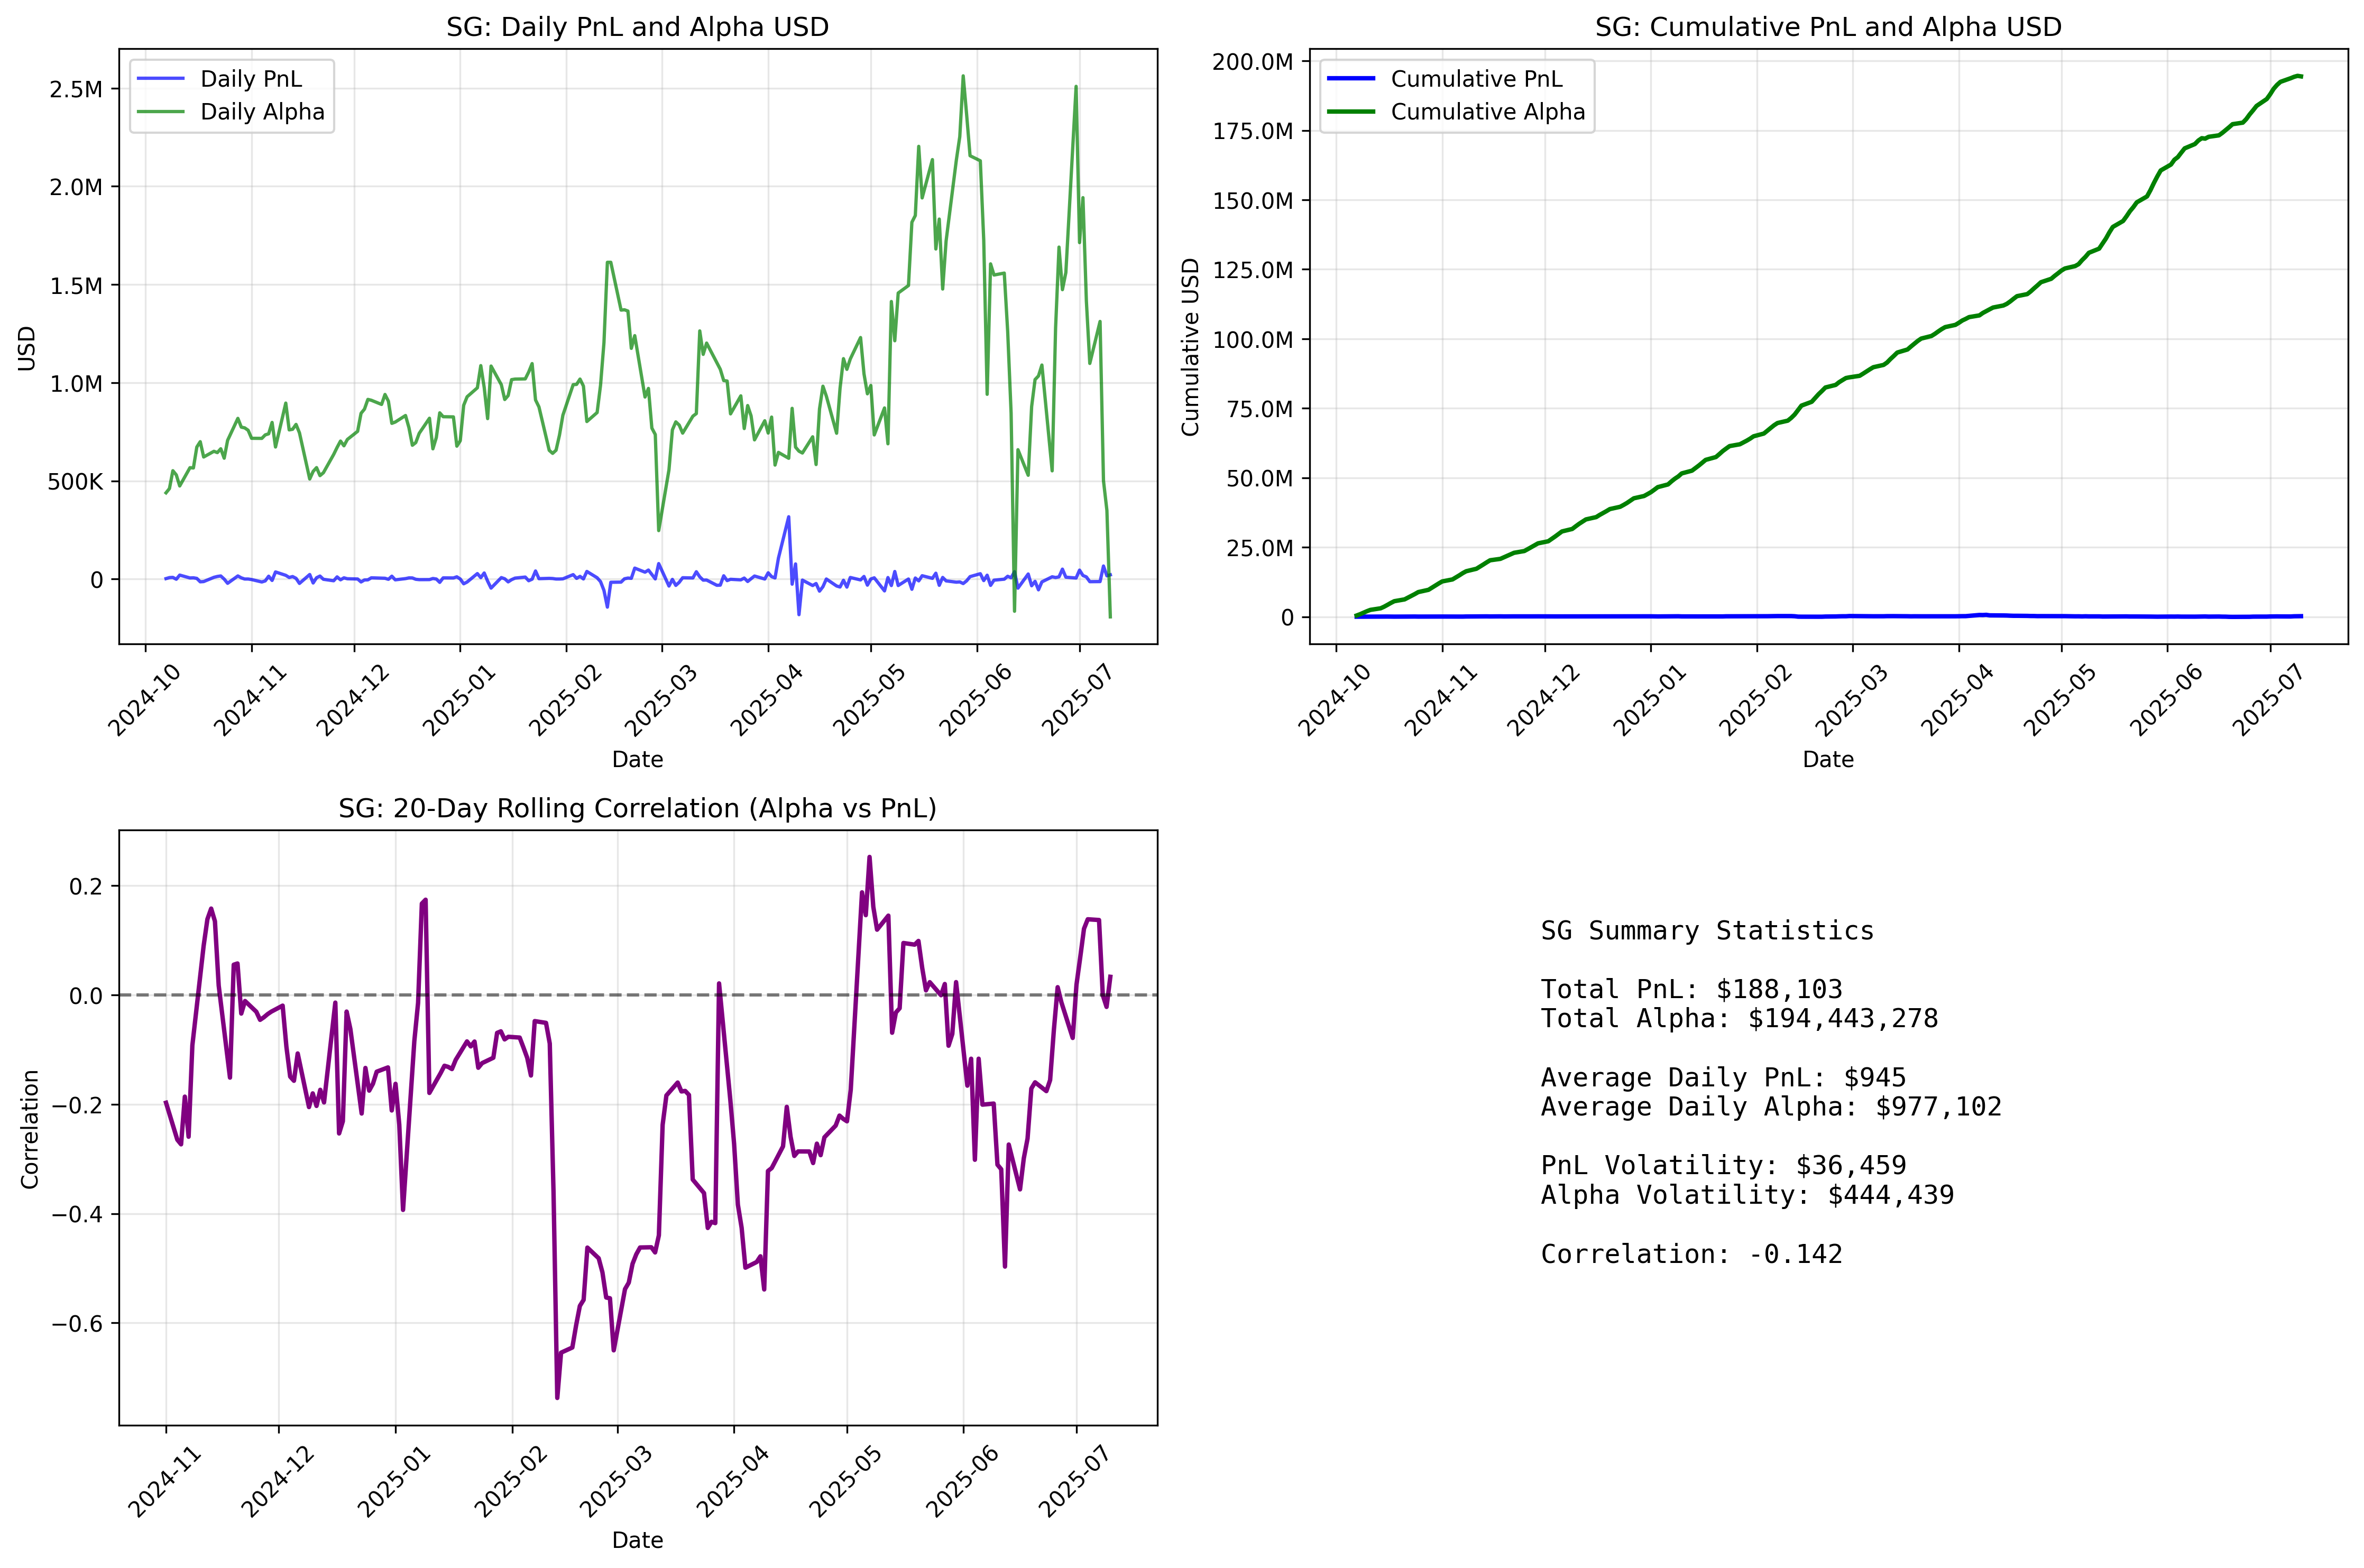
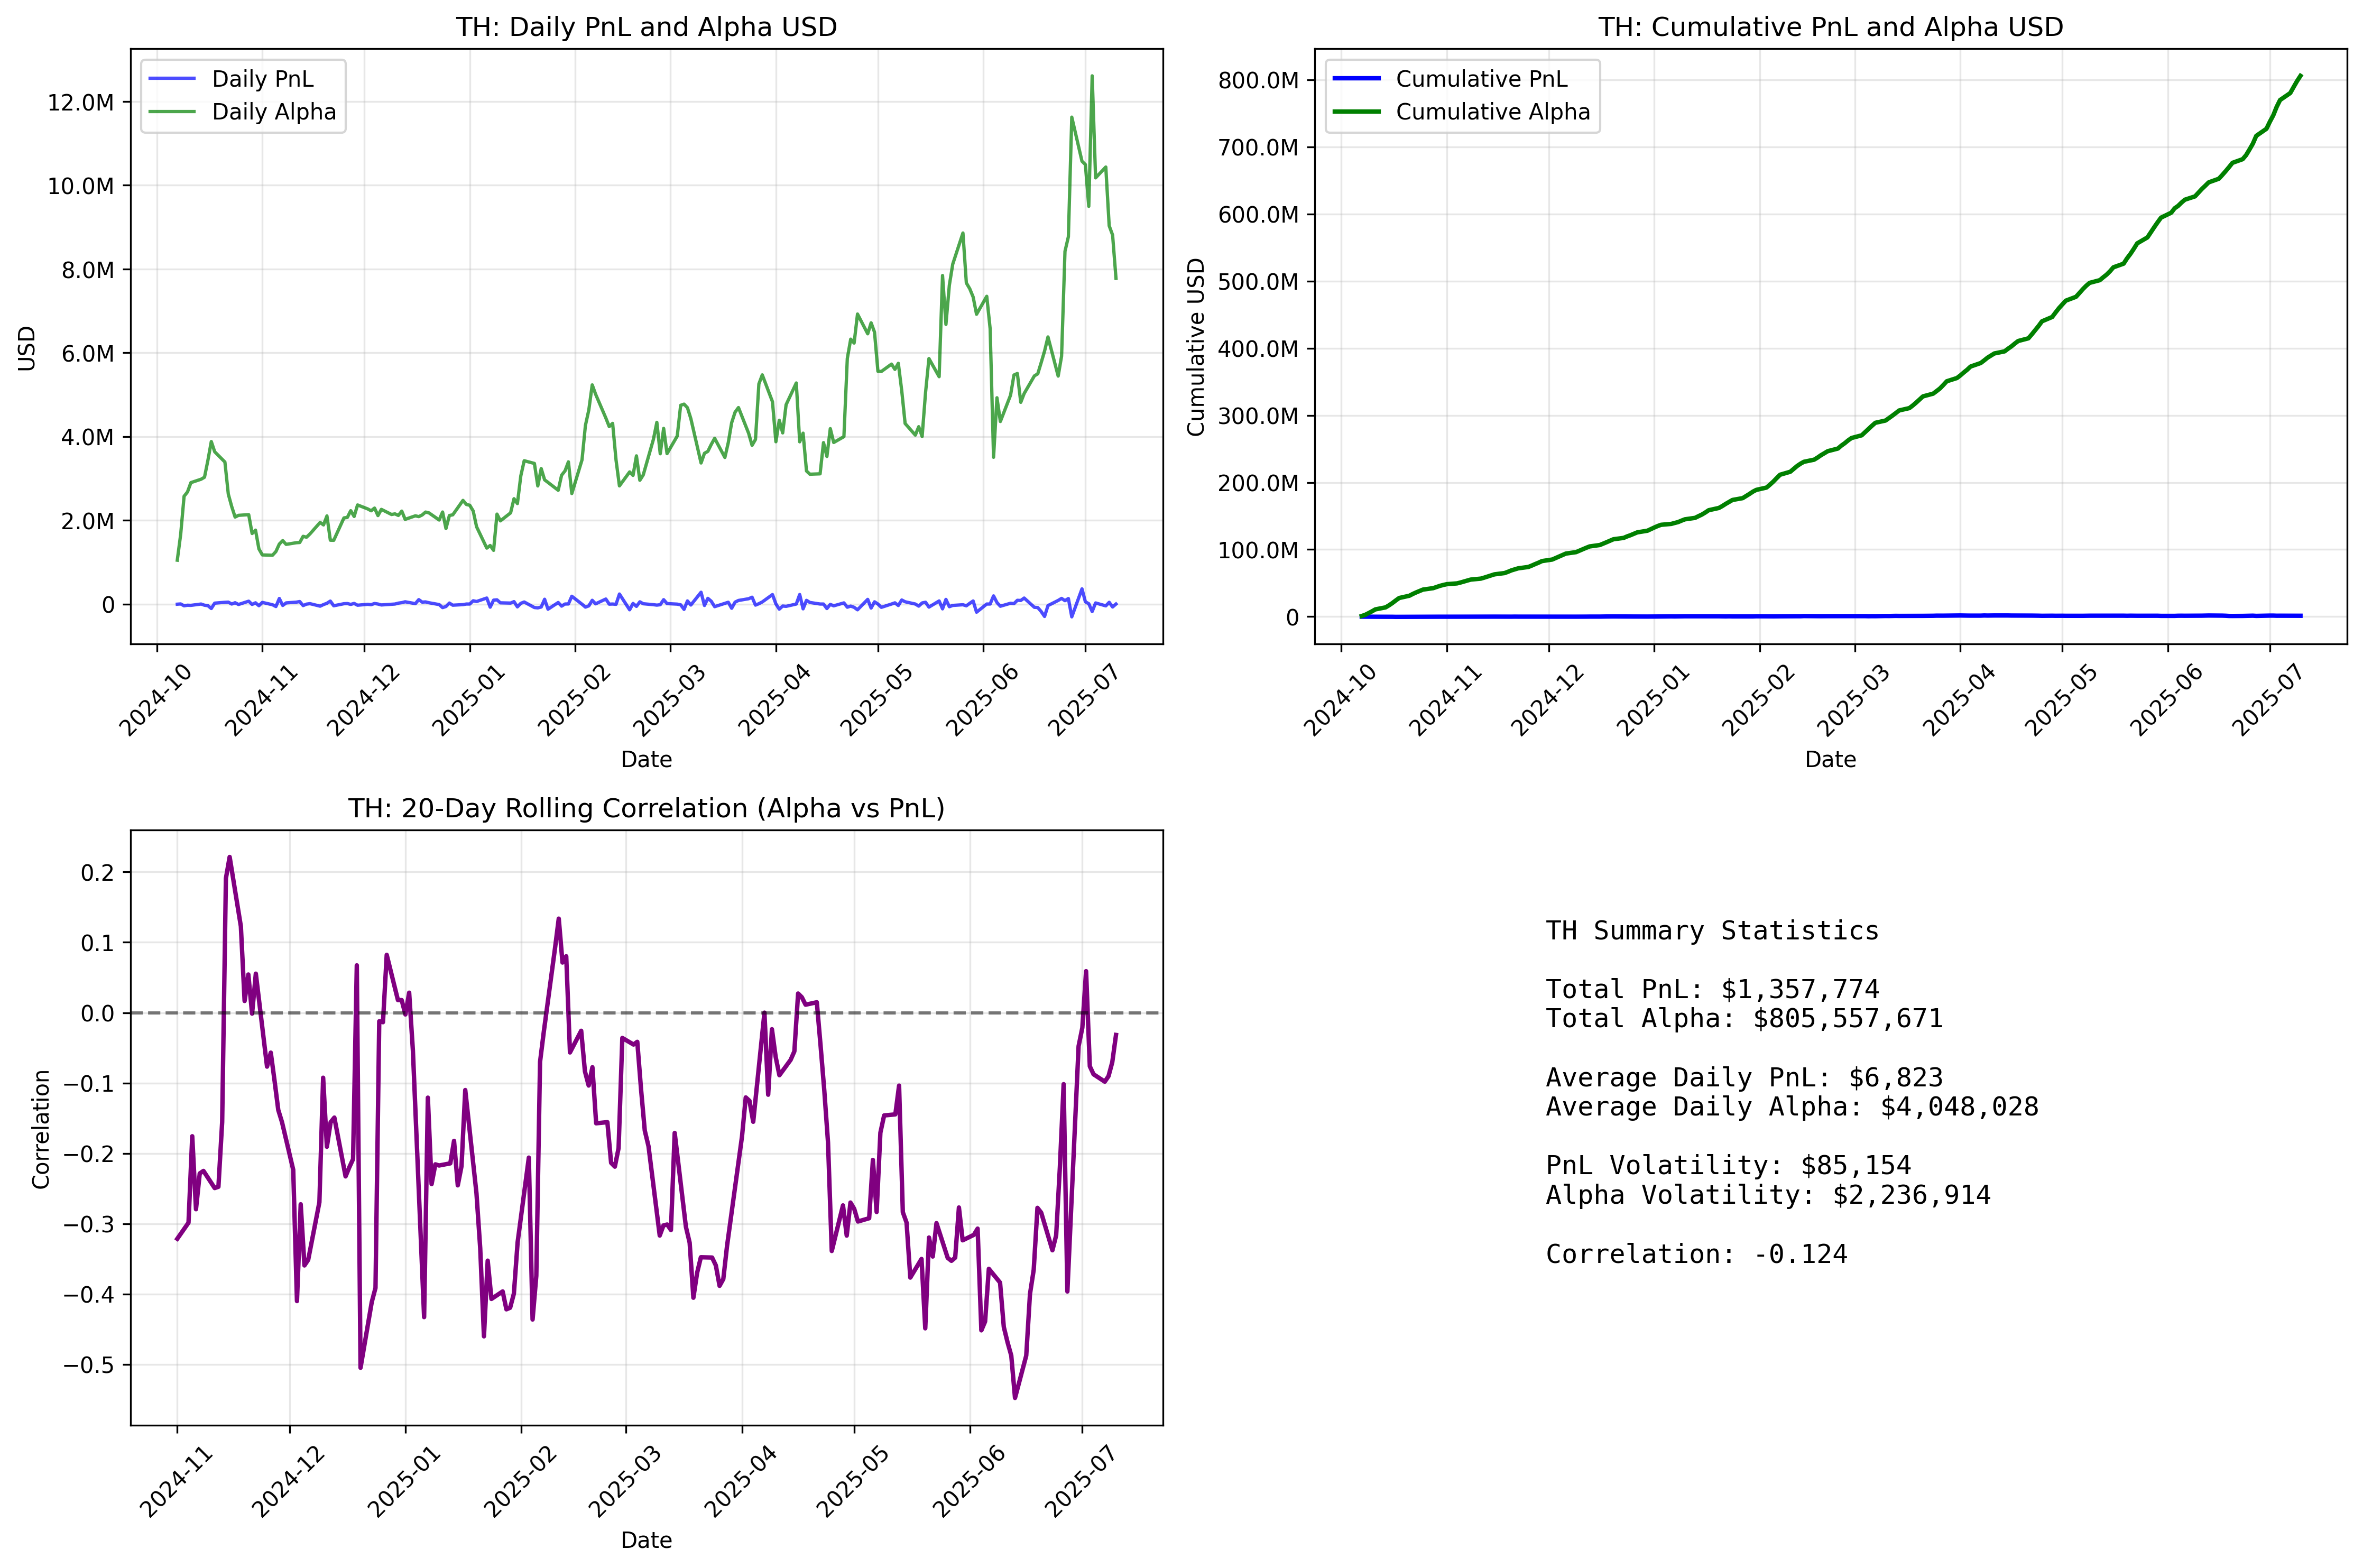
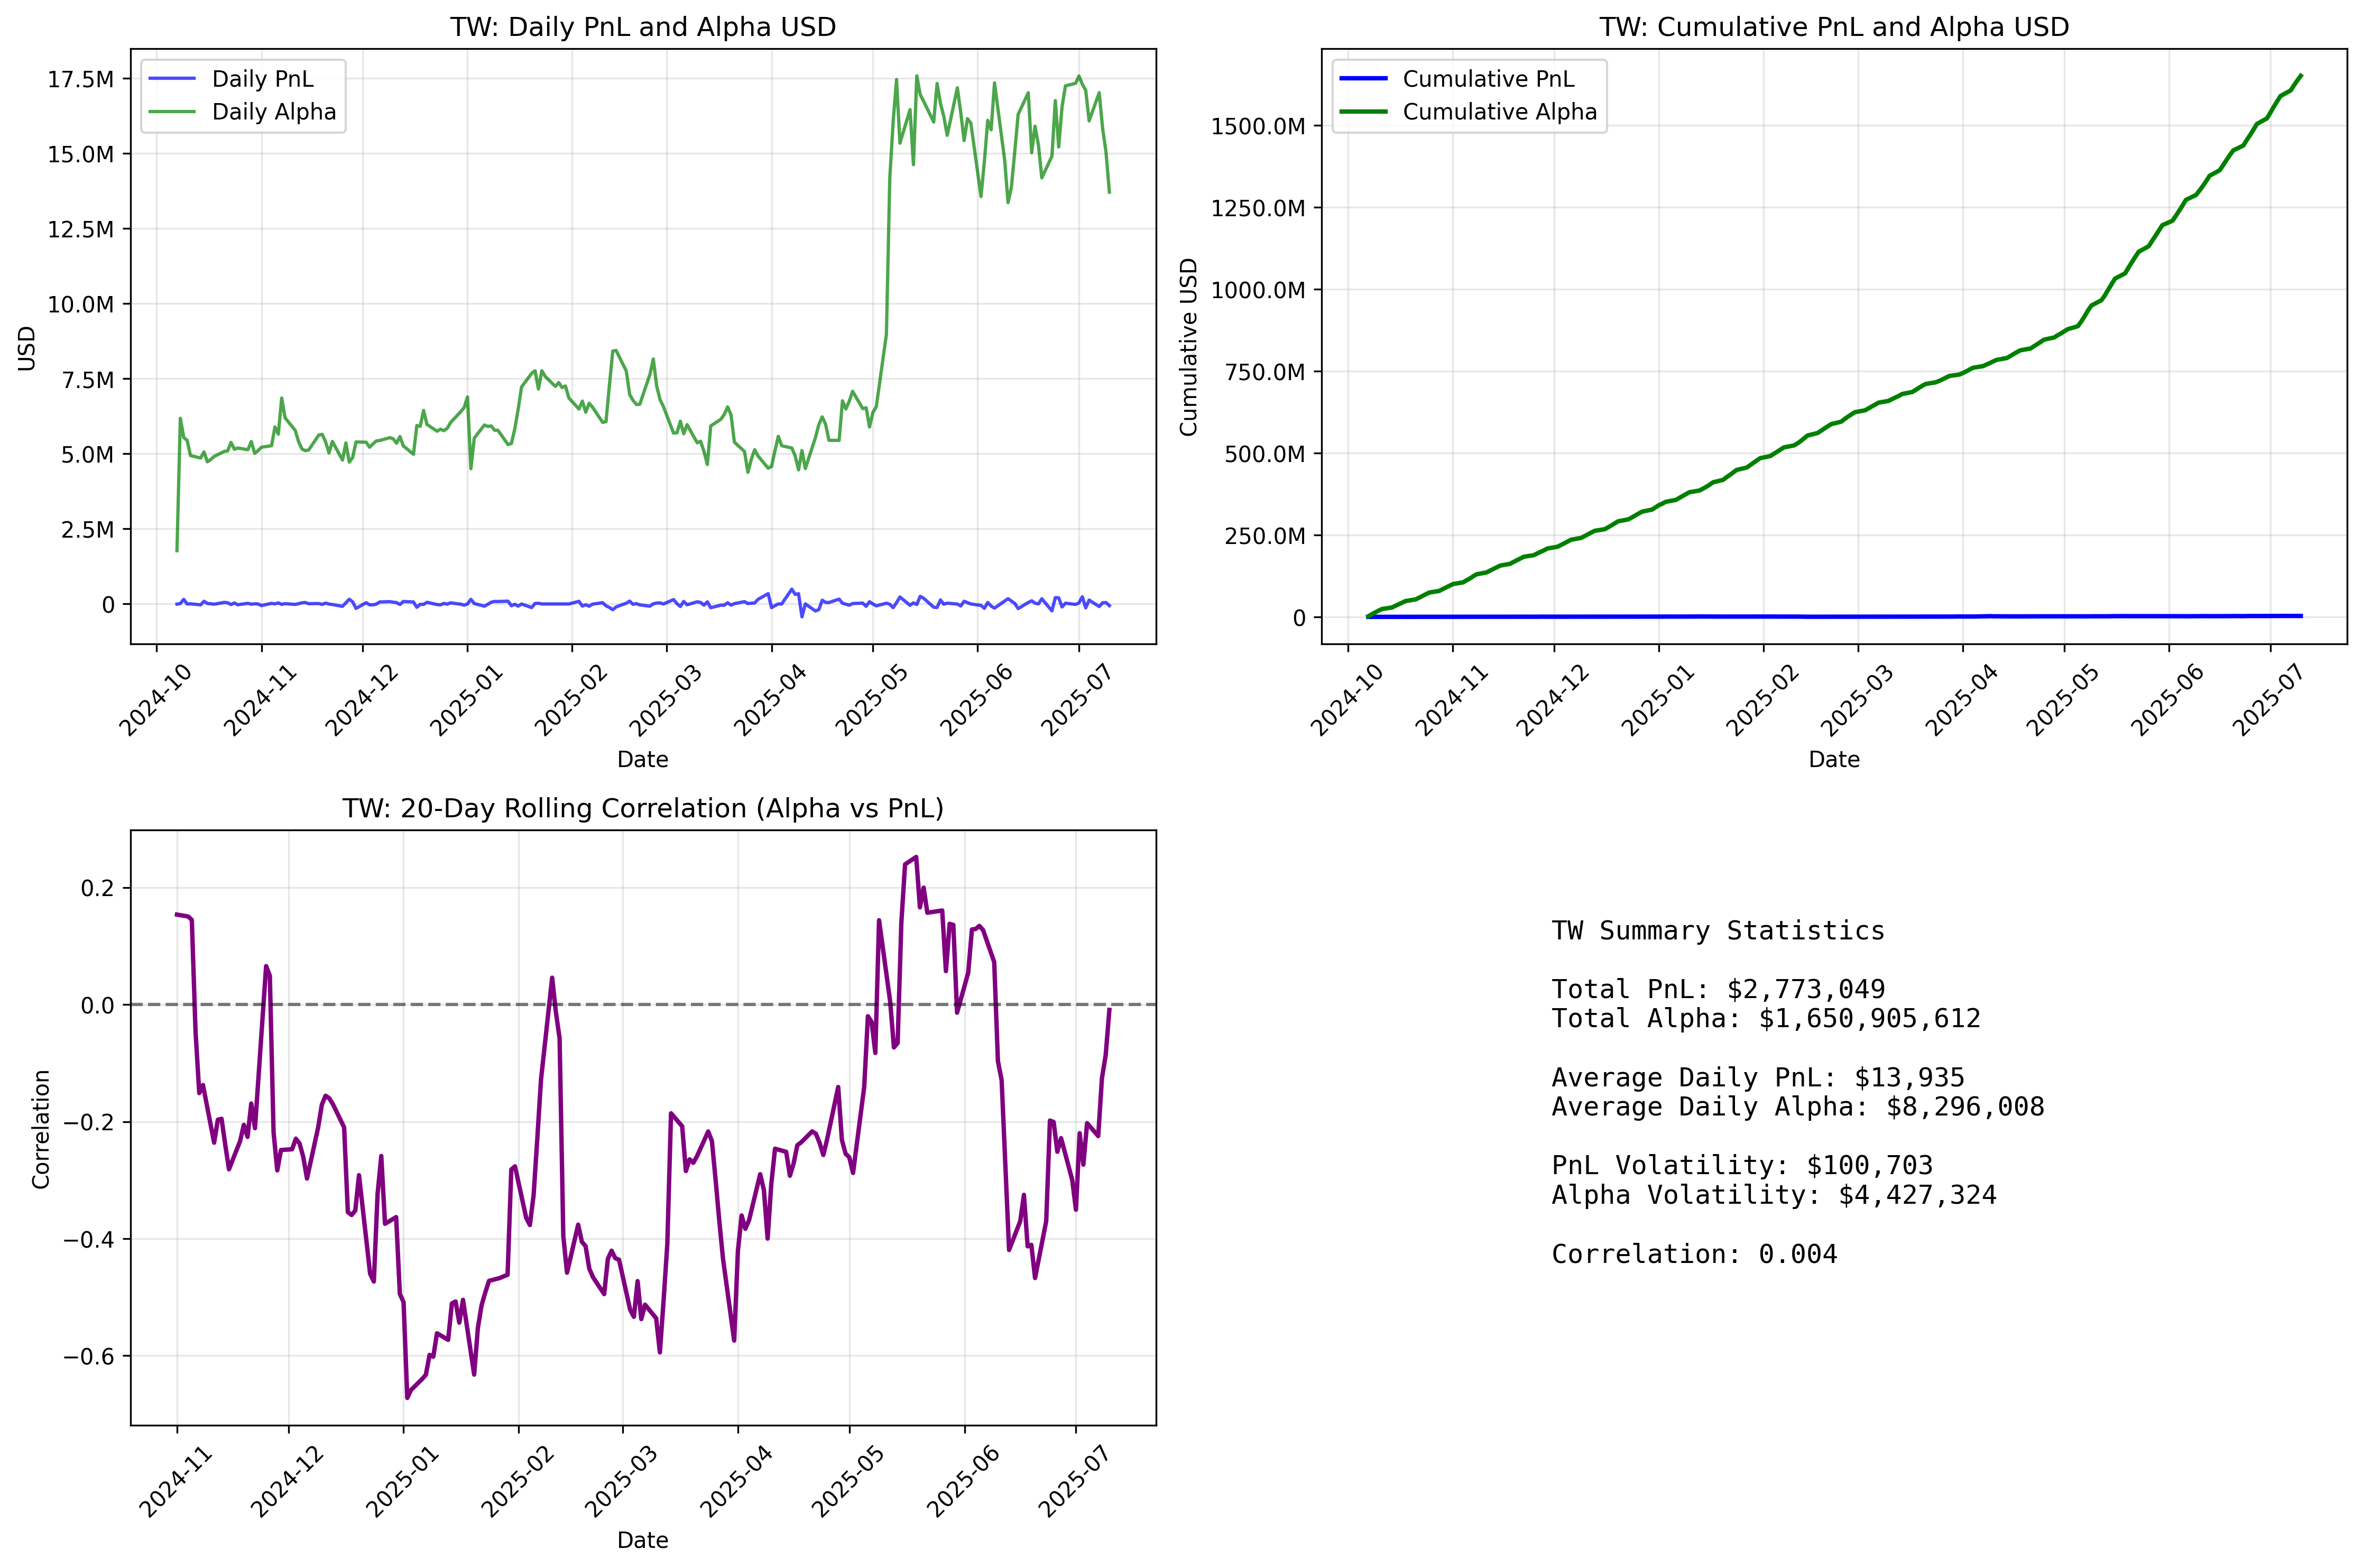
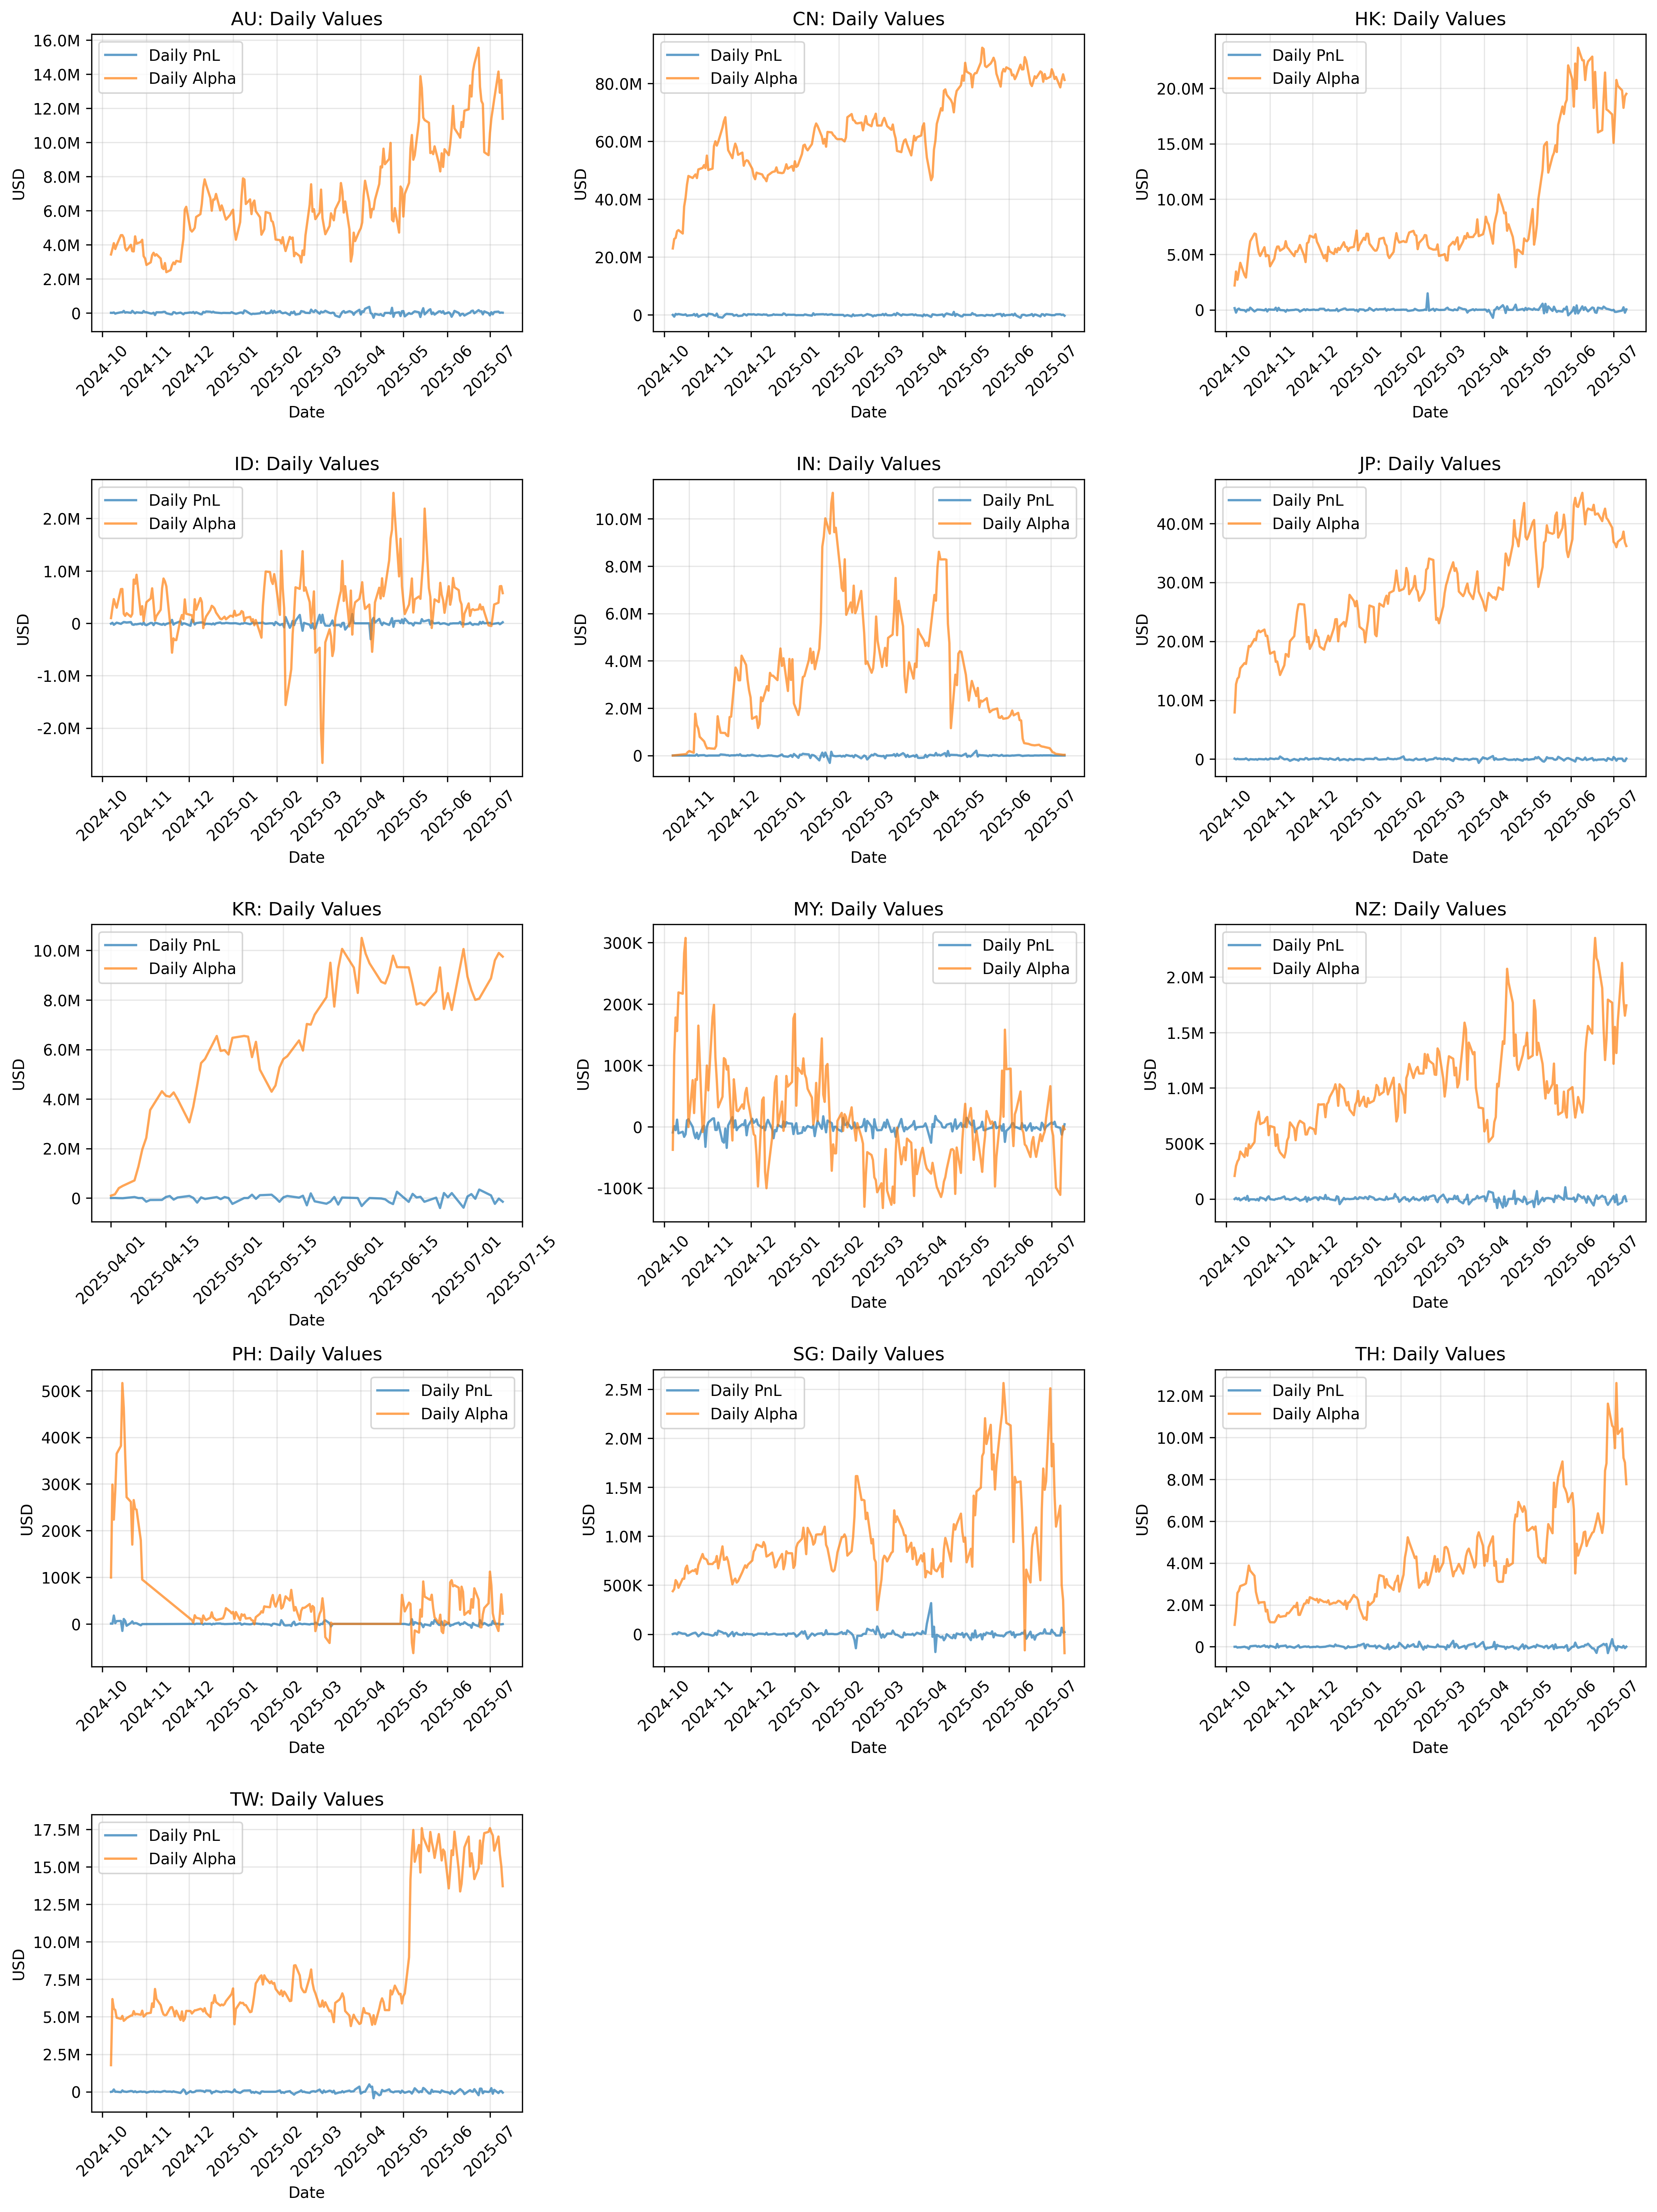
Time Series Analysis
This report analyzes the relationship between alpha signals and realized PnL for each country.
Total Countries Analyzed: 13
Average R² (All Data): 0.024
Countries with Positive Slope (All Data): 2 / 13
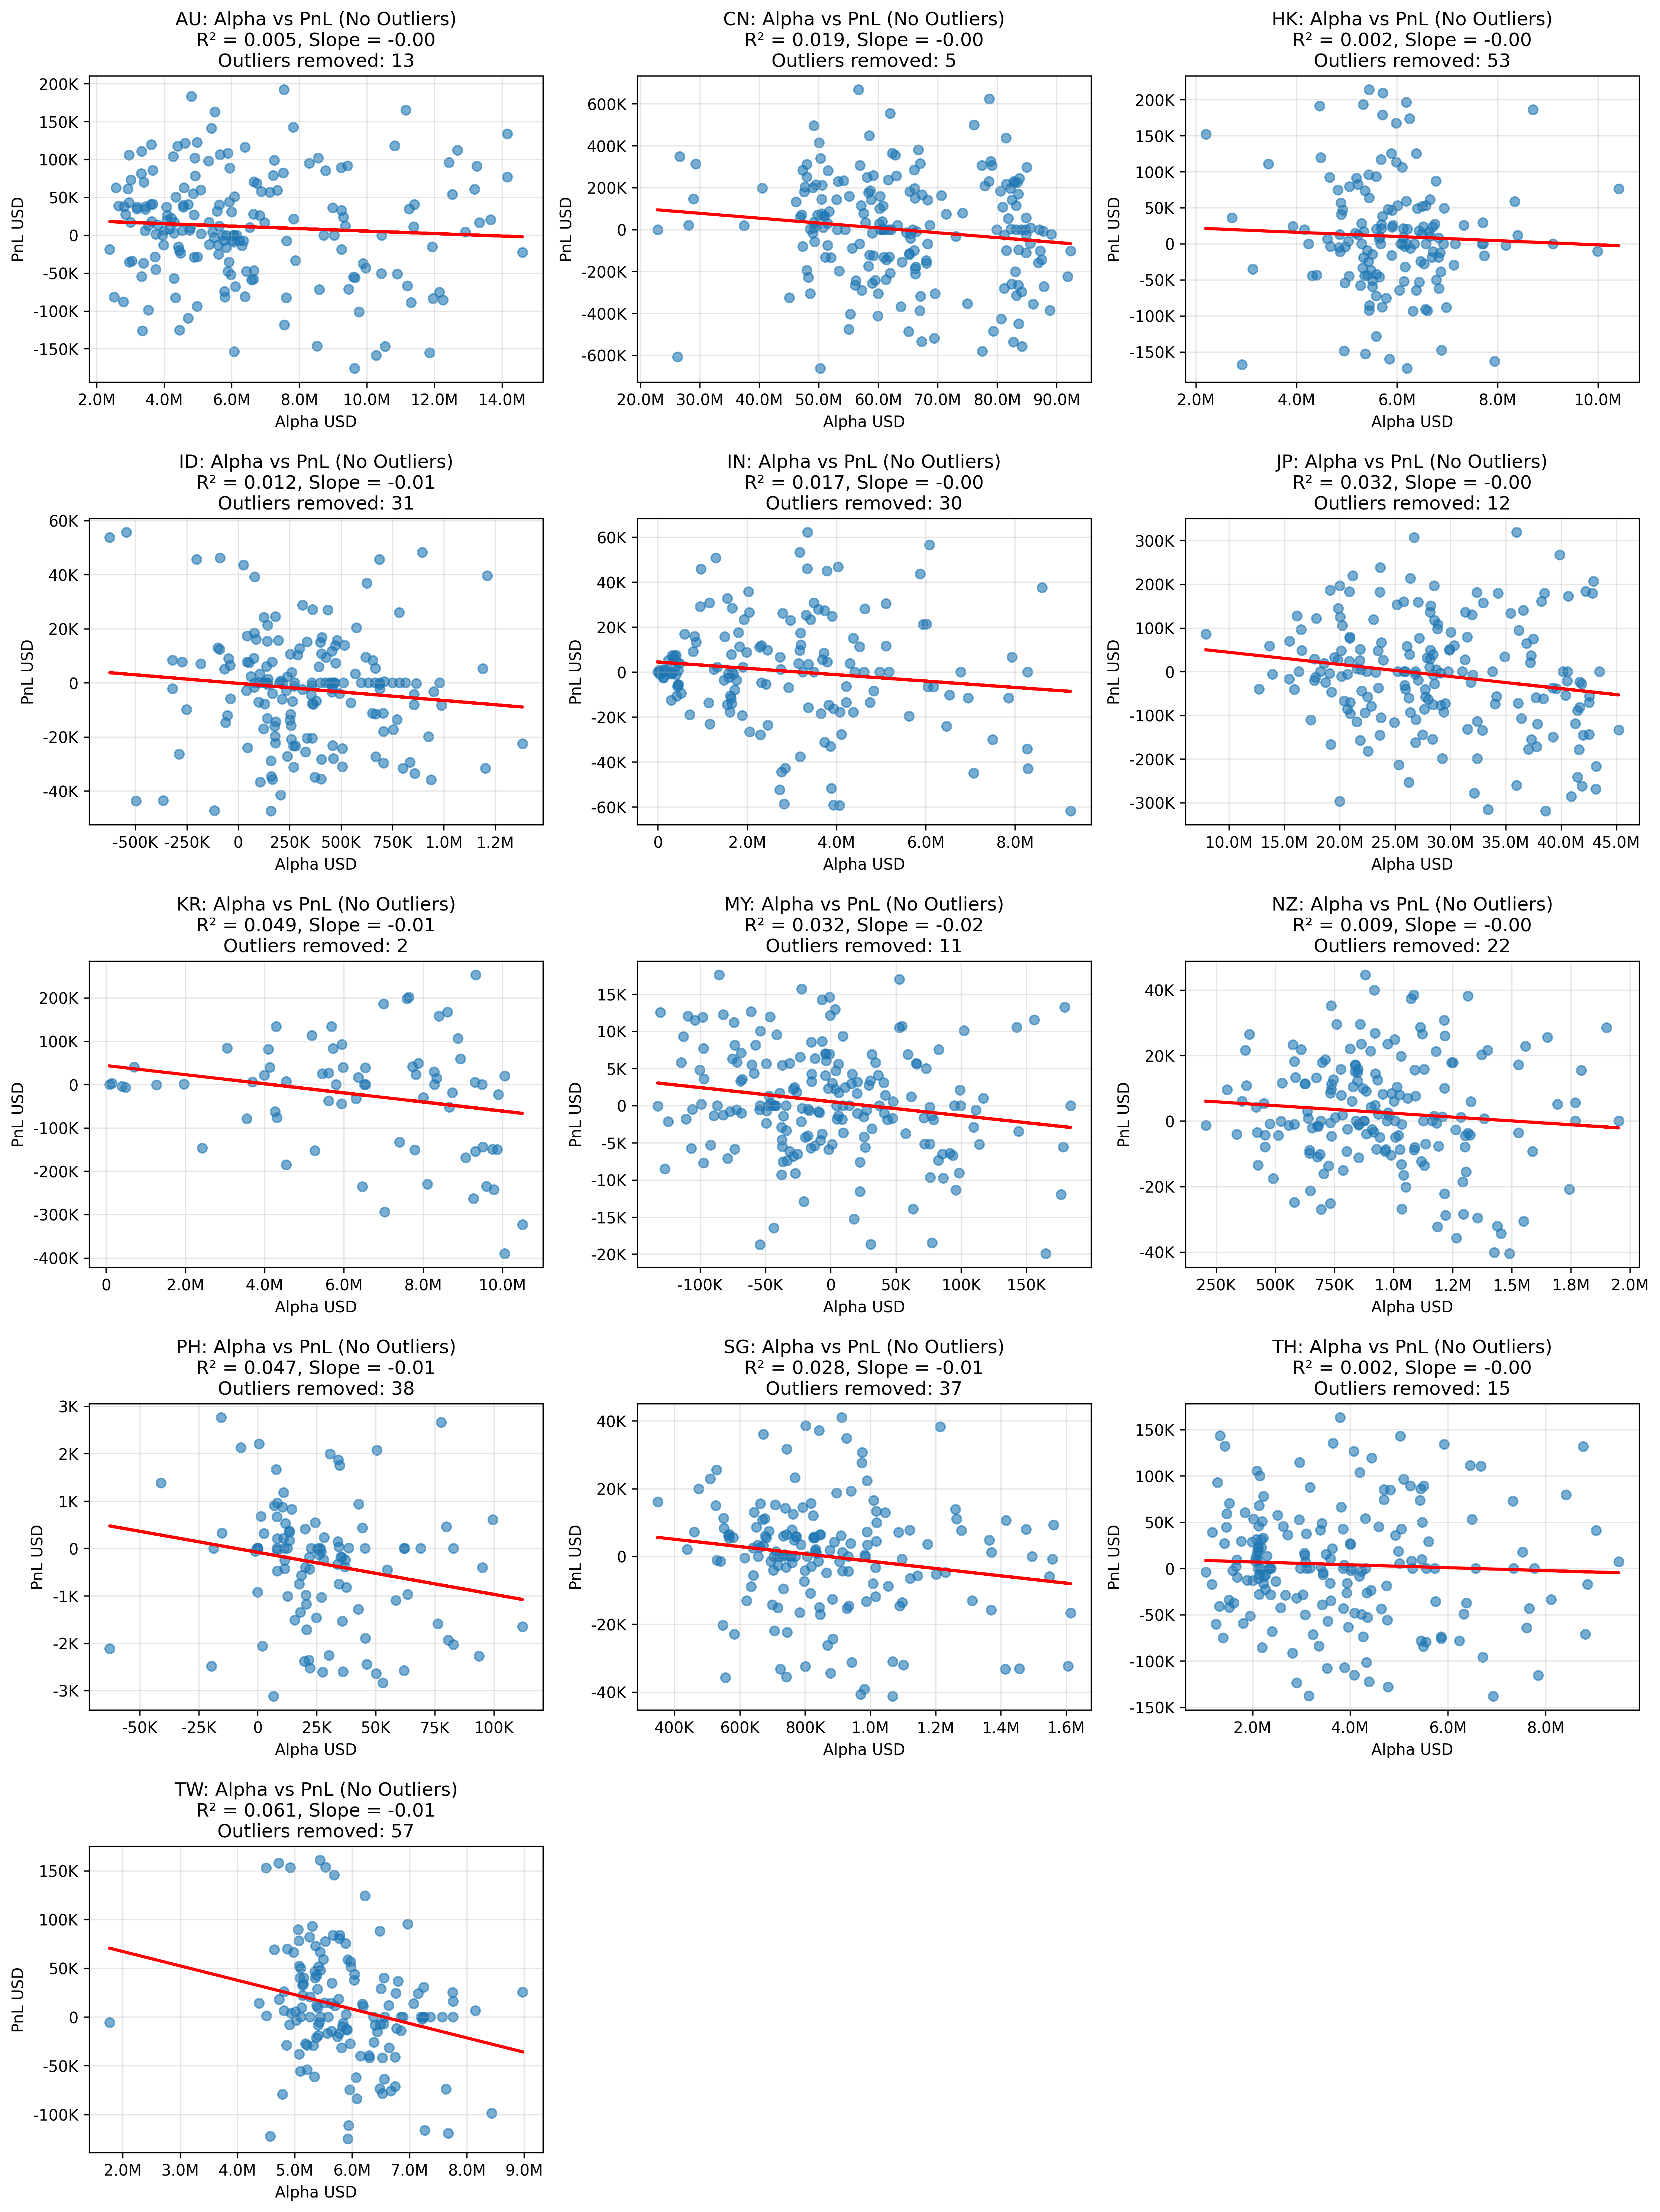
Average R² (No Outliers): 0.024
Countries with Positive Slope (No Outliers): 0 / 13
| Country | Slope | Intercept | R² | Correlation | Observations | Total PnL | Total Alpha |
|---|---|---|---|---|---|---|---|
| AU | -0 | 17,969 | 0.002 | -0.039 | 199 | $1,988,287 | $1,329,858,940 |
| CN | -0 | 133,389 | 0.014 | -0.119 | 199 | $-2,821,200 | $12,846,220,962 |
| HK | -0 | 29,532 | 0.001 | -0.032 | 199 | $3,978,545 | $1,738,492,790 |
| ID | -0 | 4,091 | 0.020 | -0.140 | 199 | $79,798 | $64,682,055 |
| IN | -0 | 2,068 | 0.002 | -0.045 | 183 | $-212,929 | $614,580,726 |
| JP | -0 | 94,230 | 0.029 | -0.171 | 199 | $-692,608 | $5,758,885,547 |
| KR | -0 | 48,813 | 0.047 | -0.216 | 73 | $-1,776,255 | $476,268,630 |
| MY | -0 | -288 | 0.071 | -0.267 | 199 | $-98,170 | $1,375,863 |
| NZ | -0 | 18,257 | 0.079 | -0.281 | 199 | $72,566 | $203,362,982 |
| PH | 0 | 36 | 0.006 | 0.078 | 175 | $30,027 | $8,179,771 |
| SG | -0 | 12,320 | 0.020 | -0.142 | 199 | $188,103 | $194,443,278 |
| TH | -0 | 25,928 | 0.015 | -0.124 | 199 | $1,357,774 | $805,557,671 |
| TW | 0 | 13,233 | 0.000 | 0.004 | 199 | $2,773,049 | $1,650,905,612 |
| AU | -0 | 21,721 | 0.005 | -0.069 | 186 | $2,055,519 | $1,216,653,172 |
| CN | -0 | 147,166 | 0.019 | -0.137 | 194 | $-497,686 | $12,518,681,669 |
| HK | -0 | 27,580 | 0.002 | -0.045 | 146 | $1,508,661 | $865,399,793 |
| ID | -0 | -200 | 0.012 | -0.108 | 168 | $-394,576 | $57,038,844 |
| IN | -0 | 4,450 | 0.017 | -0.132 | 153 | $63,003 | $436,561,591 |
| JP | -0 | 71,915 | 0.032 | -0.180 | 187 | $-1,408,761 | $5,365,983,706 |
| KR | -0 | 43,713 | 0.049 | -0.222 | 71 | $-1,714,442 | $458,902,108 |
| MY | -0 | 524 | 0.032 | -0.180 | 188 | $102,969 | $-234,880 |
| NZ | -0 | 7,045 | 0.009 | -0.095 | 177 | $453,860 | $169,753,734 |
| PH | -0 | -82 | 0.047 | -0.216 | 137 | $-37,281 | $2,937,146 |
| SG | -0 | 9,379 | 0.028 | -0.168 | 162 | $-13,140 | $142,084,130 |
| TH | -0 | 10,093 | 0.002 | -0.048 | 184 | $764,024 | $699,890,592 |
| TW | -0 | 96,658 | 0.061 | -0.246 | 142 | $1,369,758 | $837,273,265 |
| Country | Slope | Intercept | R² | Correlation | Observations | Outliers Removed | Total PnL | Total Alpha |
|---|---|---|---|---|---|---|---|---|
| TW | -0 | 96,658 | 0.061 | -0.246 | 142 | 57.0 | $1,369,758 | $837,273,265 |
| KR | -0 | 43,713 | 0.049 | -0.222 | 71 | 2.0 | $-1,714,442 | $458,902,108 |
| PH | -0 | -82 | 0.047 | -0.216 | 137 | 38.0 | $-37,281 | $2,937,146 |
| JP | -0 | 71,915 | 0.032 | -0.180 | 187 | 12.0 | $-1,408,761 | $5,365,983,706 |
| MY | -0 | 524 | 0.032 | -0.180 | 188 | 11.0 | $102,969 | $-234,880 |
| SG | -0 | 9,379 | 0.028 | -0.168 | 162 | 37.0 | $-13,140 | $142,084,130 |
| CN | -0 | 147,166 | 0.019 | -0.137 | 194 | 5.0 | $-497,686 | $12,518,681,669 |
| IN | -0 | 4,450 | 0.017 | -0.132 | 153 | 30.0 | $63,003 | $436,561,591 |
| ID | -0 | -200 | 0.012 | -0.108 | 168 | 31.0 | $-394,576 | $57,038,844 |
| NZ | -0 | 7,045 | 0.009 | -0.095 | 177 | 22.0 | $453,860 | $169,753,734 |
| AU | -0 | 21,721 | 0.005 | -0.069 | 186 | 13.0 | $2,055,519 | $1,216,653,172 |
| TH | -0 | 10,093 | 0.002 | -0.048 | 184 | 15.0 | $764,024 | $699,890,592 |
| HK | -0 | 27,580 | 0.002 | -0.045 | 146 | 53.0 | $1,508,661 | $865,399,793 |
Click on any country name in the table above to view detailed analysis including:
Generated: 2025-07-11 10:01:53