Simulation Report (trading portfolio)
(2026-07-27 13:02:11)
| period | cumret | highwater | maxDD | avgTradeWgts | avgHldPerMth | annRet | annStd | SharpeRatio |
|---|---|---|---|---|---|---|---|---|
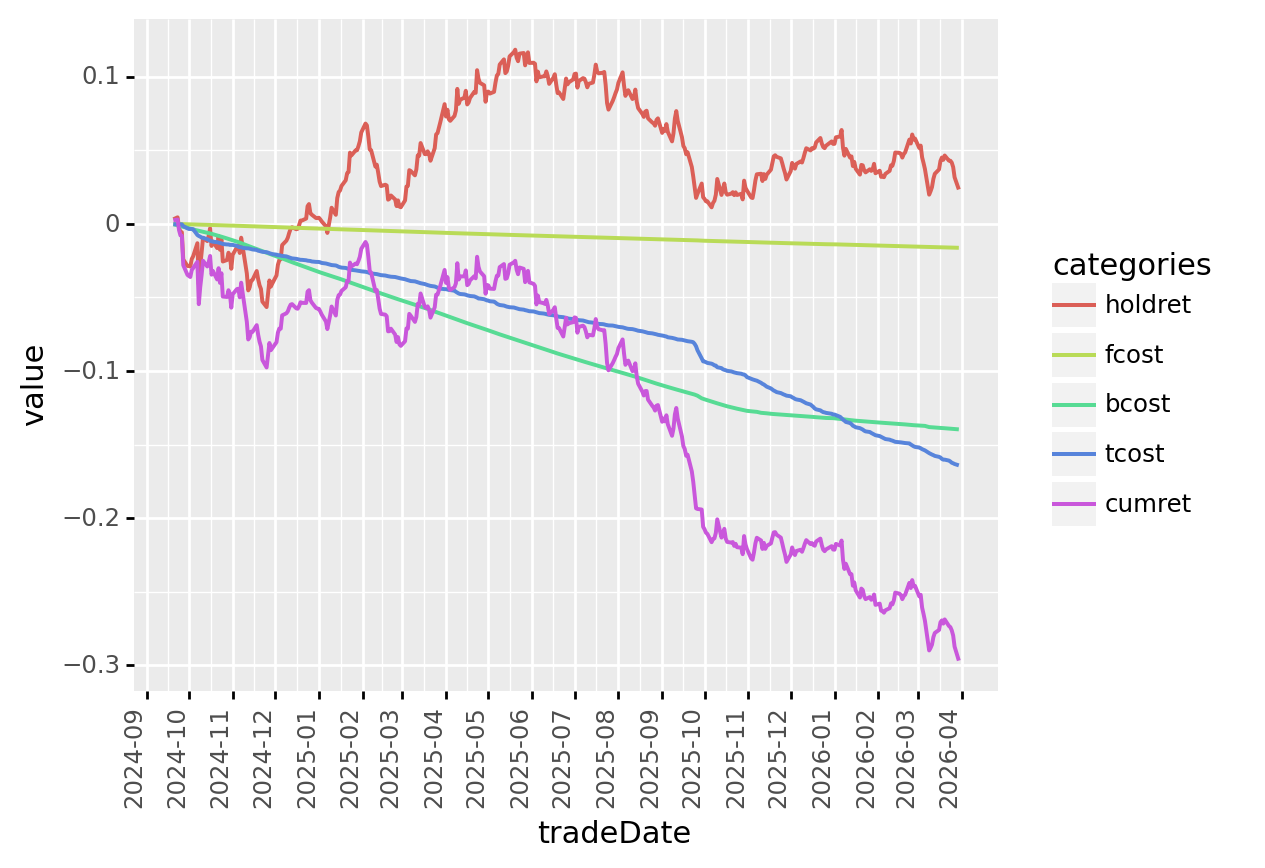
| all | -0.3323 | 0.0000 | -0.3454 | 0.3442 | 0.5760 | -0.2126 | 0.1064 | -1.9978 |
| 2024 | -0.0576 | 0.0000 | -0.0976 | 0.3080 | 0.5940 | -0.2035 | 0.1247 | -1.6325 |
| 2025 | -0.1737 | 0.0374 | -0.2121 | 0.3499 | 0.5374 | -0.1863 | 0.0938 | -1.9866 |
| 2026 | -0.1426 | 0.0000 | -0.1593 | 0.3519 | 0.6413 | -0.2632 | 0.1177 | -2.2367 |
| month | returns | tradeDate | returns | MTD | tradeDate | returns | MTD | ||
|---|---|---|---|---|---|---|---|---|---|
| 202607 | -1.43% | 2026-06-30 | 0.01% | 1.62% | 2026-07-27 | -0.64% | -1.43% | ||
| 202606 | 1.62% | 2026-06-29 | -1.06% | 1.60% | 2026-07-24 | -0.21% | -0.80% | ||
| 202605 | -2.61% | 2026-06-26 | -0.61% | 2.70% | 2026-07-23 | -0.41% | -0.59% | ||
| 202604 | -1.86% | 2026-06-25 | -0.27% | 3.32% | 2026-07-22 | -0.64% | -0.17% | ||
| 202603 | -7.50% | 2026-06-24 | -0.51% | 3.60% | 2026-07-21 | -0.89% | 0.47% | ||
| 202602 | 1.74% | 2026-06-23 | -1.04% | 4.14% | 2026-07-20 | 0.69% | 1.37% | ||
| 202601 | -4.83% | 2026-06-22 | 0.95% | 5.24% | 2026-07-17 | 0.23% | 0.68% | ||
| 202512 | 1.09% | 2026-06-19 | 0.01% | 4.24% | 2026-07-16 | 0.17% | 0.45% | ||
| 202511 | -1.12% | 2026-06-18 | 0.02% | 4.24% | 2026-07-15 | 0.84% | 0.28% | ||
| 202510 | -1.90% | 2026-06-17 | -0.29% | 4.22% | 2026-07-14 | -0.19% | -0.55% | ||
| 202509 | -9.43% | 2026-06-16 | -0.28% | 4.53% | 2026-07-13 | 0.36% | -0.36% | ||
| 202508 | -3.81% | 2026-06-15 | 0.68% | 4.82% | 2026-07-10 | 0.35% | -0.72% | ||
| 202507 | -2.32% | 2026-06-12 | 1.49% | 4.11% | 2026-07-09 | 0.20% | -1.06% | ||
| 202506 | -2.82% | 2026-06-11 | 0.45% | 2.58% | 2026-07-08 | -0.09% | -1.26% | ||
| 202505 | 0.18% | 2026-06-10 | 0.51% | 2.12% | 2026-07-07 | -1.07% | -1.17% | ||
| 202504 | -1.05% | 2026-06-09 | 0.49% | 1.60% | 2026-07-06 | -0.44% | -0.11% | ||
| 202503 | 5.62% | 2026-06-08 | -0.93% | 1.10% | 2026-07-03 | 0.01% | 0.33% | ||
| 202502 | -6.71% | 2026-06-05 | 0.35% | 2.05% | 2026-07-02 | -0.25% | 0.33% | ||
| 202501 | 4.31% | 2026-06-04 | -1.10% | 1.70% | 2026-07-01 | 0.58% | 0.58% | ||
| 202412 | 2.94% | 2026-06-03 | -0.94% | 2.83% | |||||
| 202411 | -2.92% | 2026-06-02 | 1.18% | 3.80% | |||||
| 202410 | -2.30% | 2026-06-01 | 2.60% | 2.60% | |||||
| 202409 | -3.48% |
|
|
|
|
| tau=40, gamma=15, maxRisk=0.1, maxLeverage=4.0 |
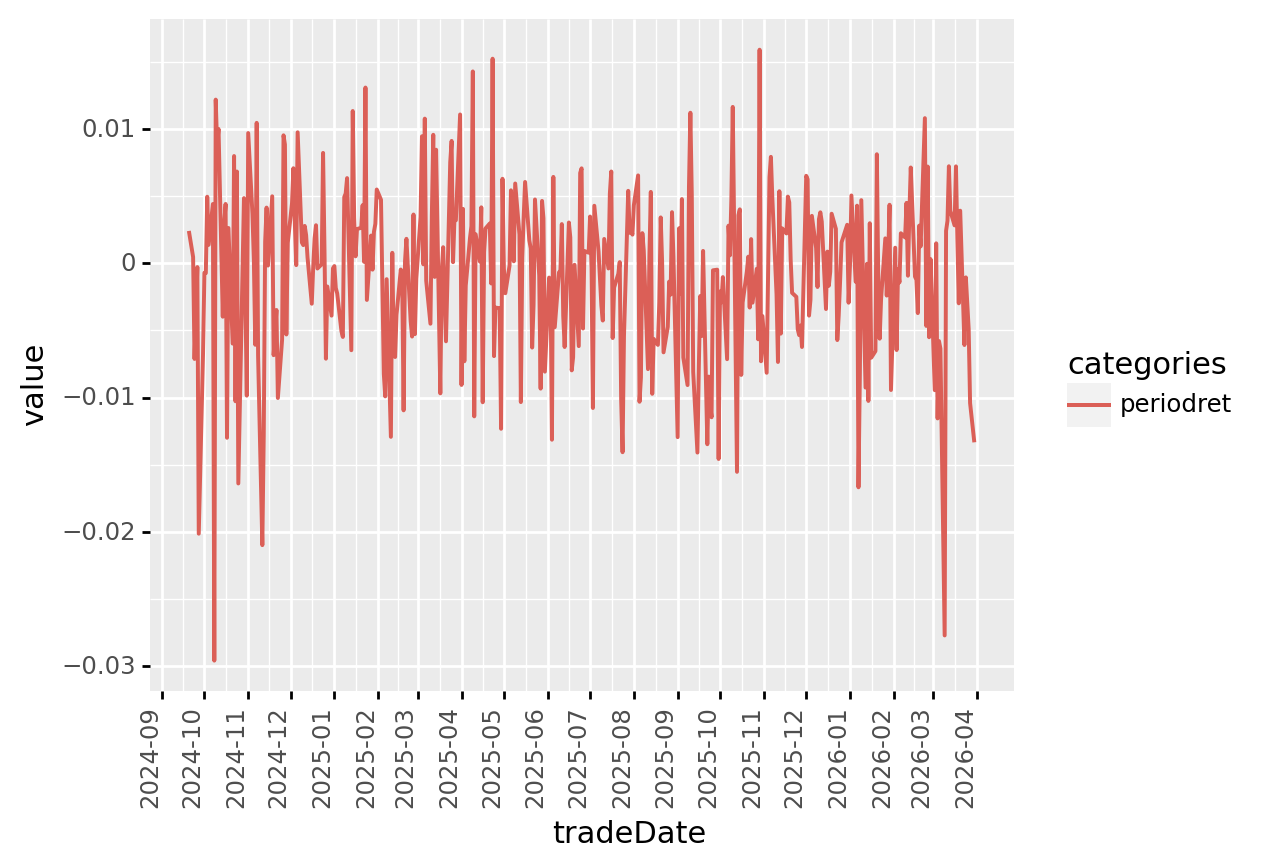
| Cumulative Returns | Period Returns | Drawdown (Month-end) |
|---|---|---|
 |
 |
.png) |
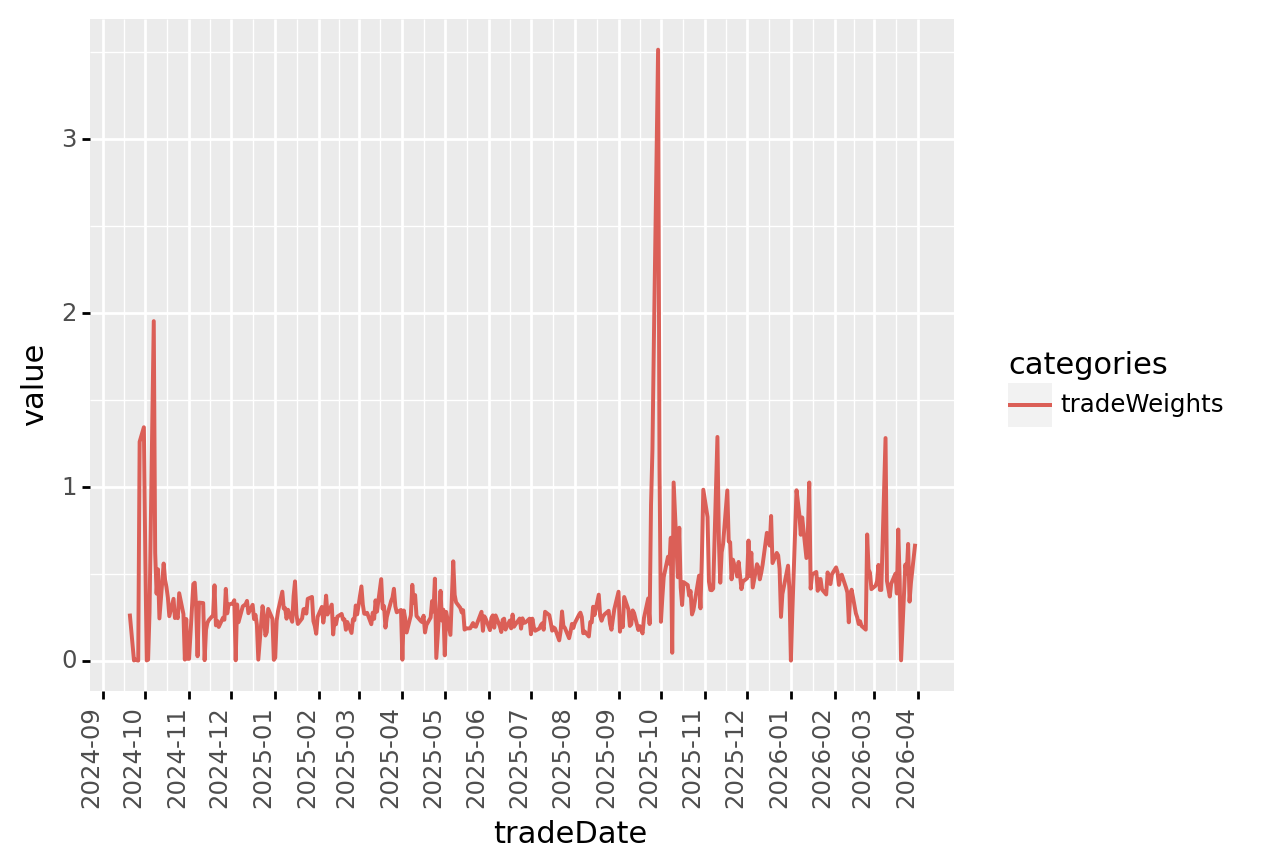
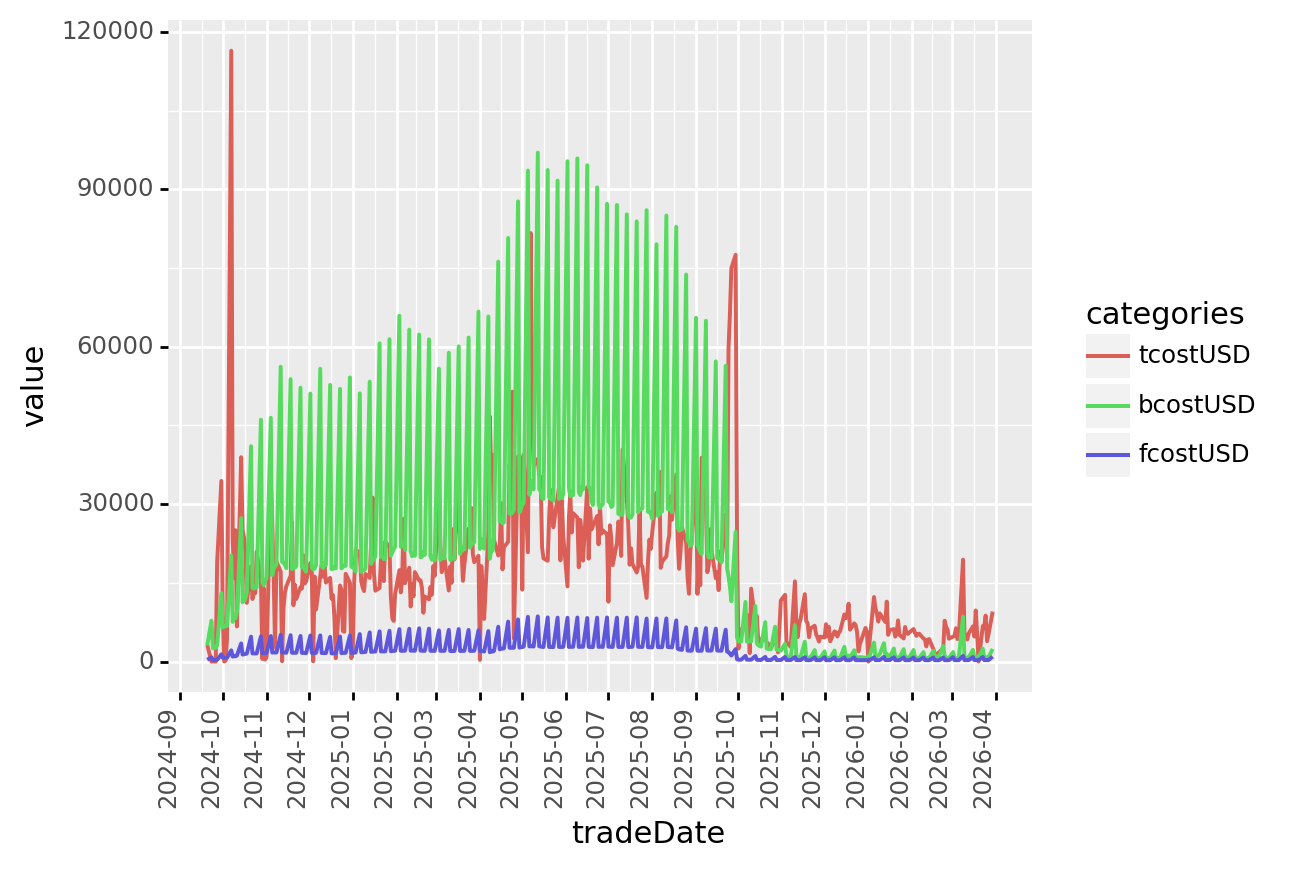
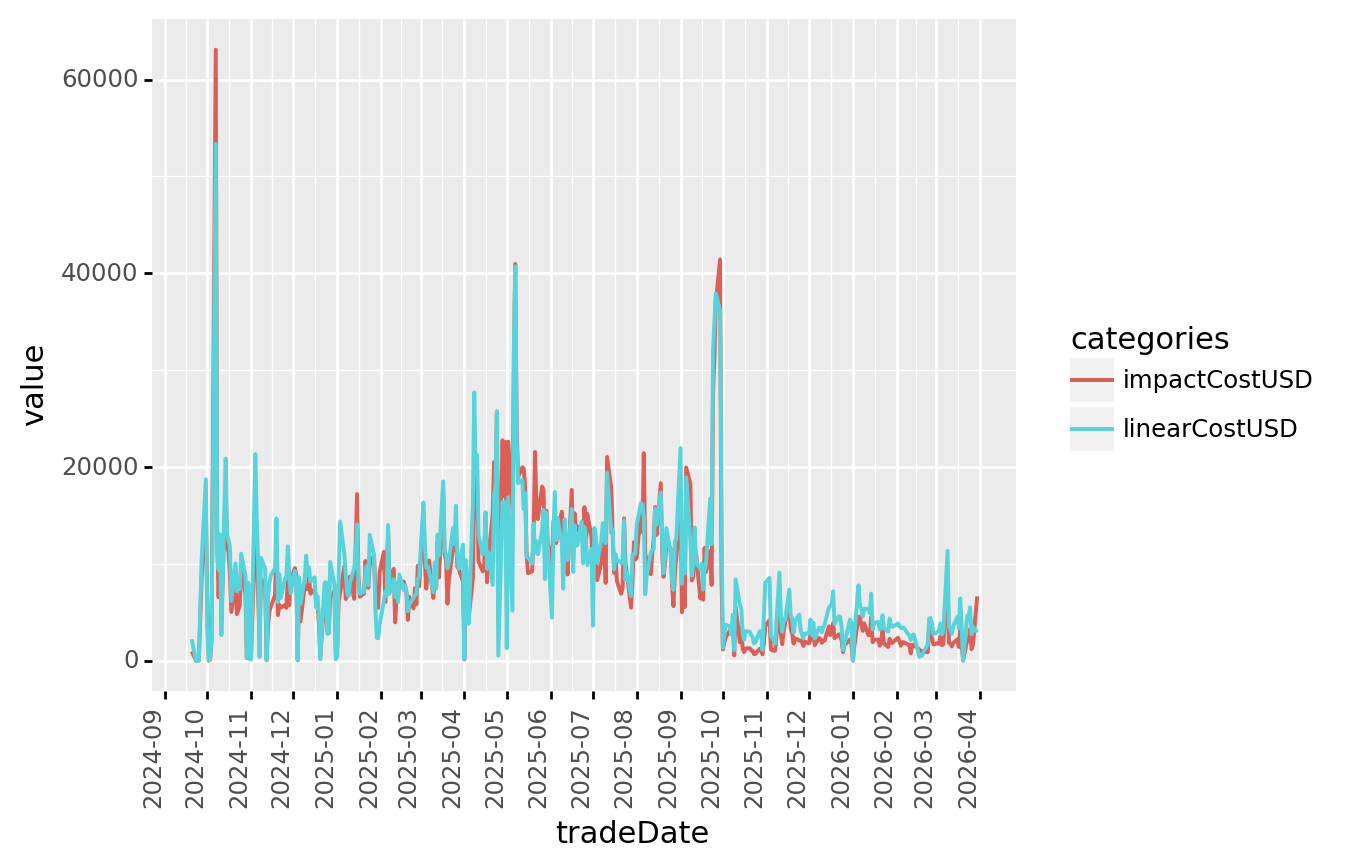
| Trade Weight | Costs | TCost Breakdown |
|---|---|---|
 |
 |
 |
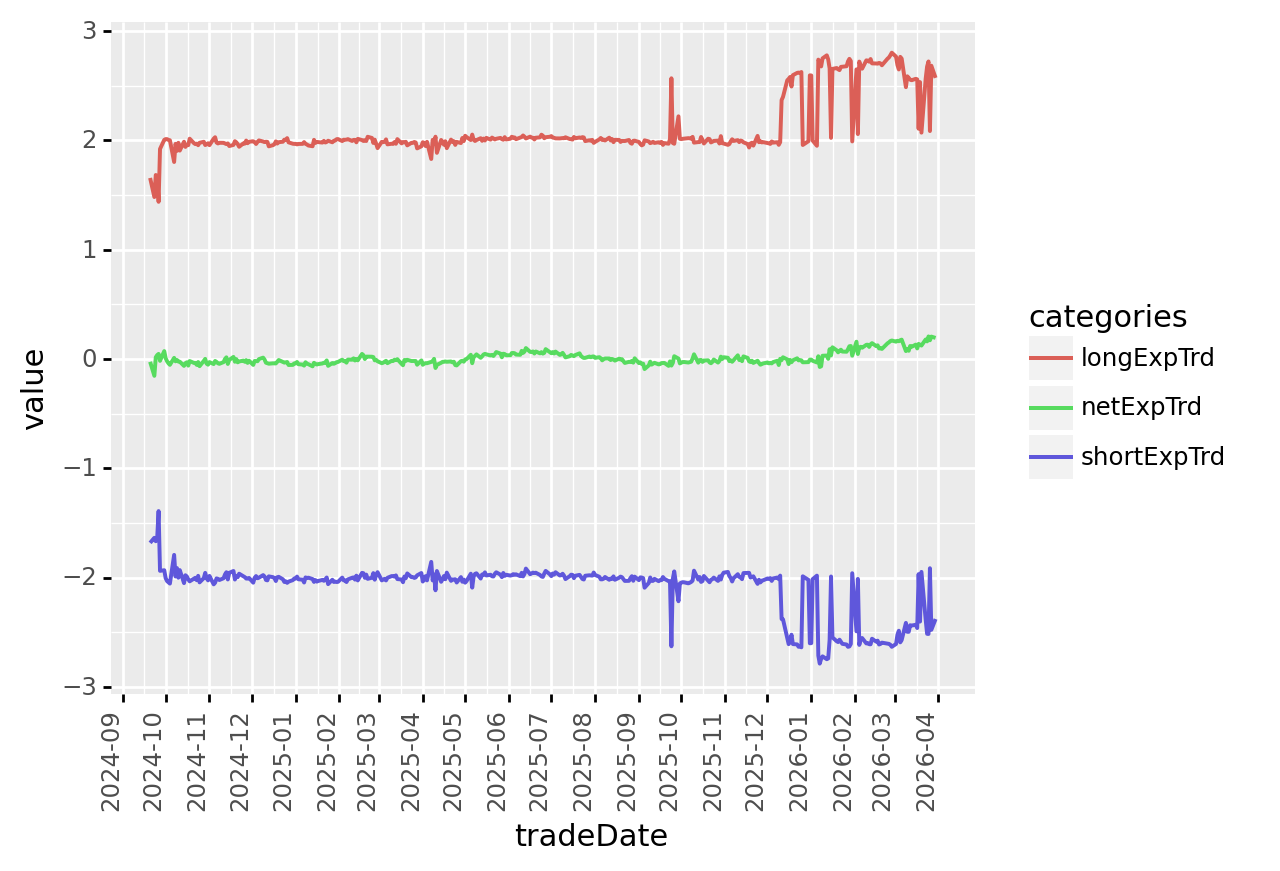
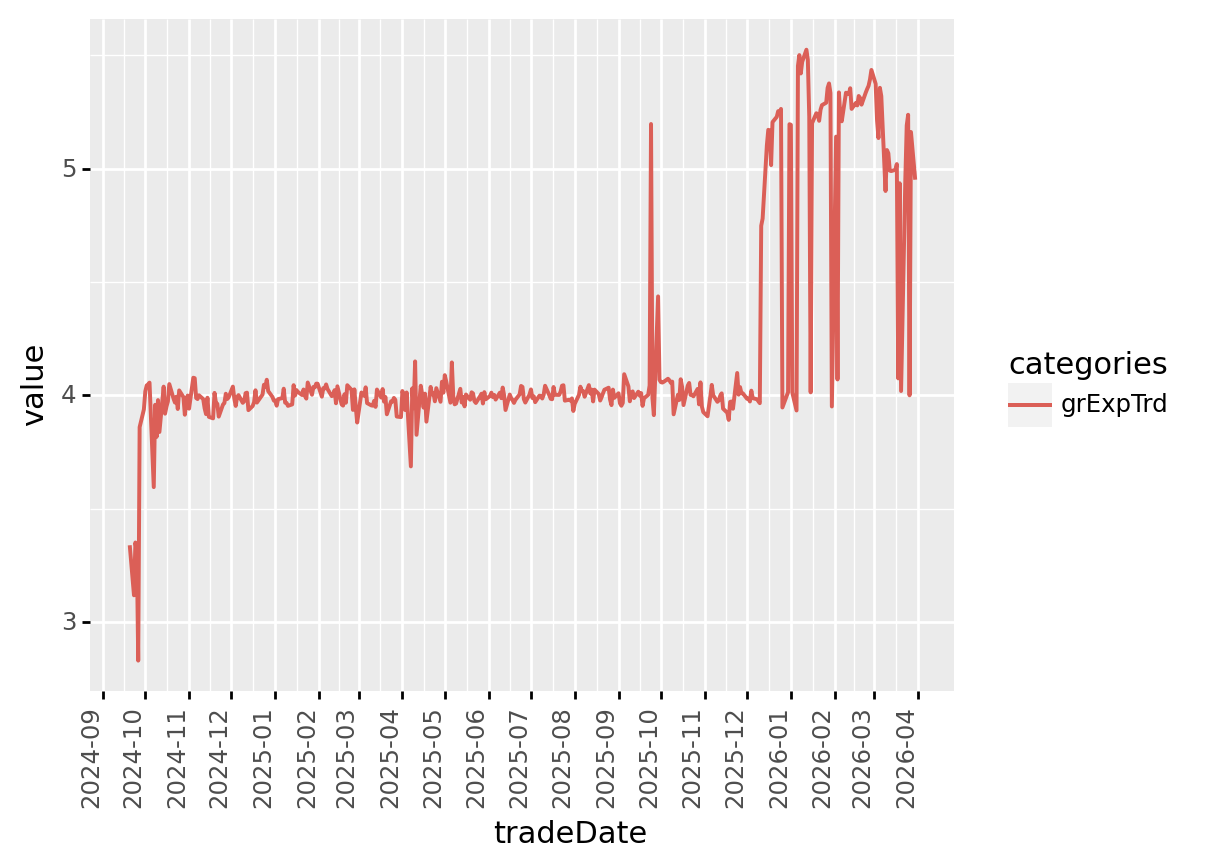
| Net Exposures | Gross Exposures |
|---|---|
 |
 |
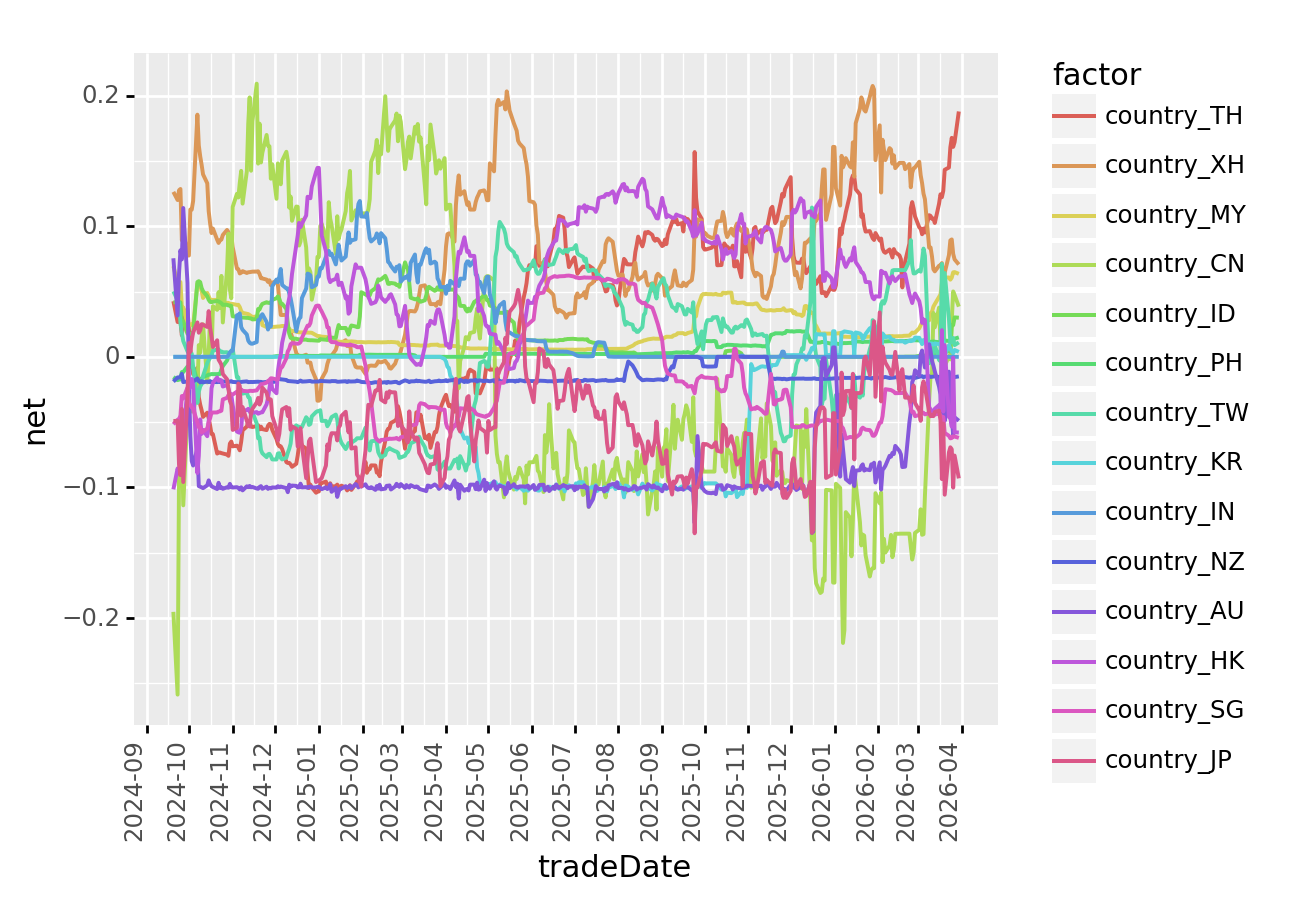
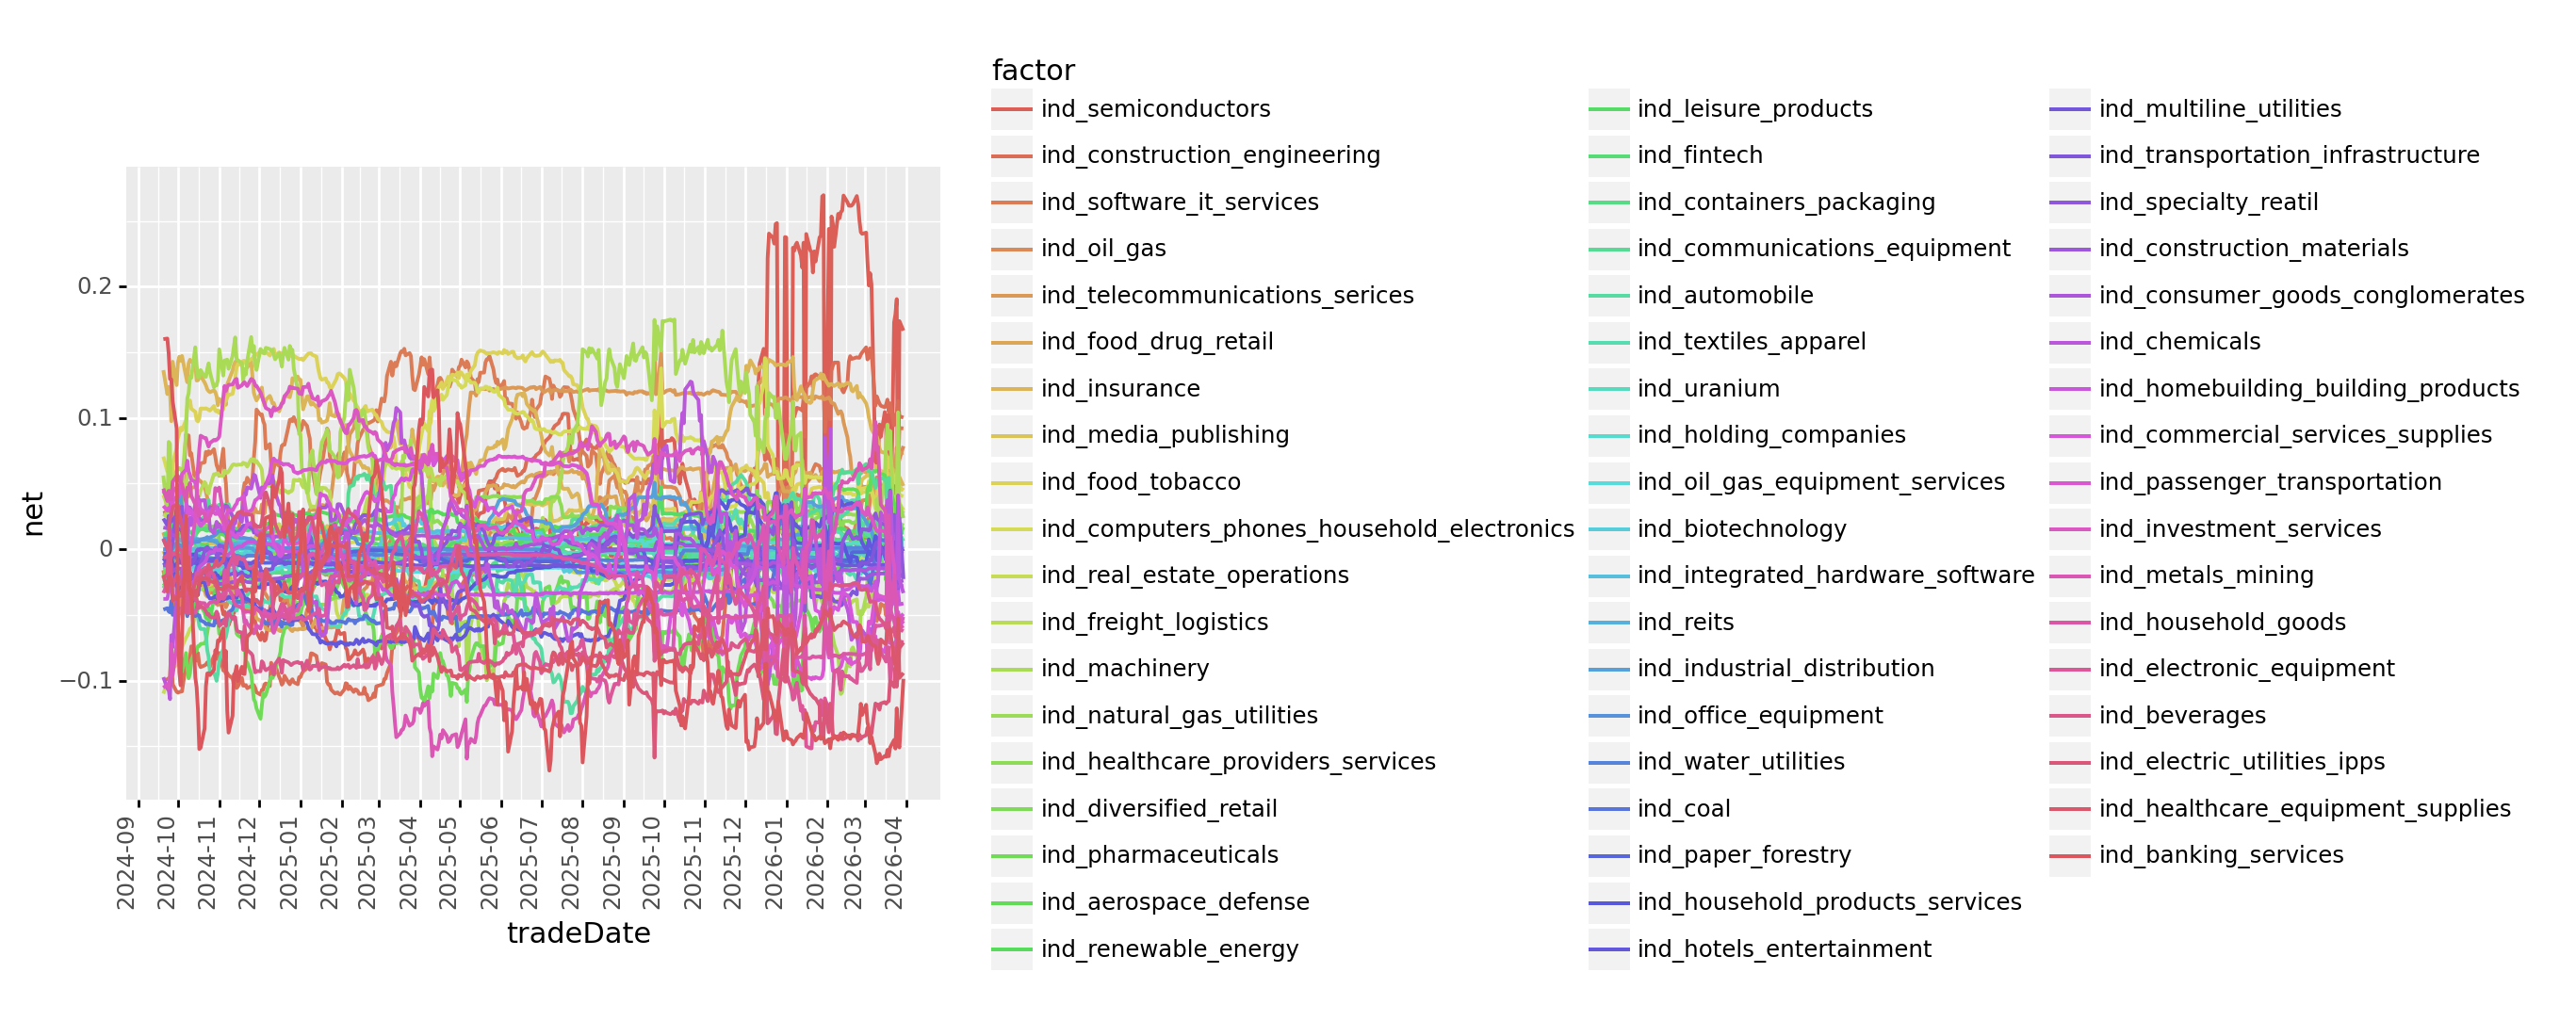
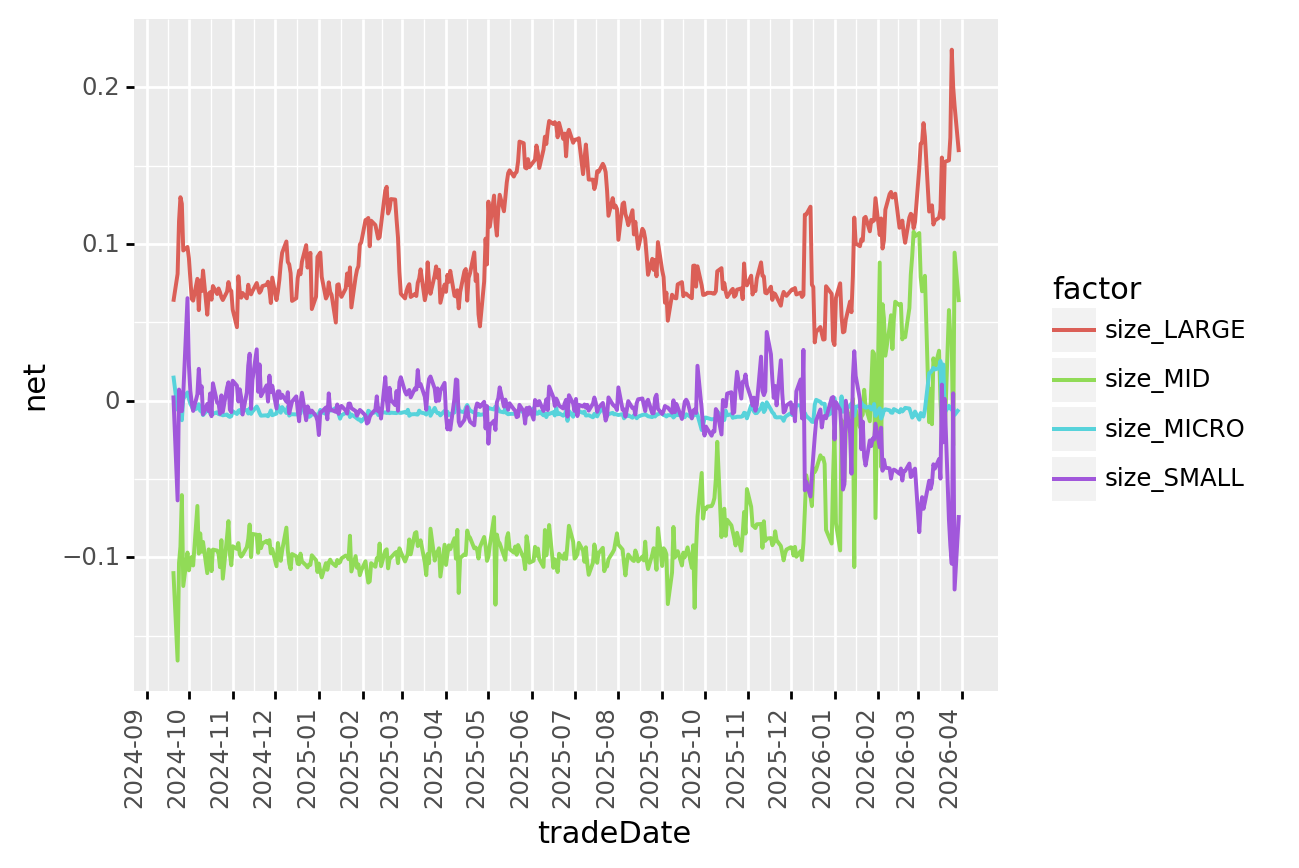
| Country Net Exp | Industry Net Exp | Size Net Exp |
|---|---|---|
 |
 |
 |
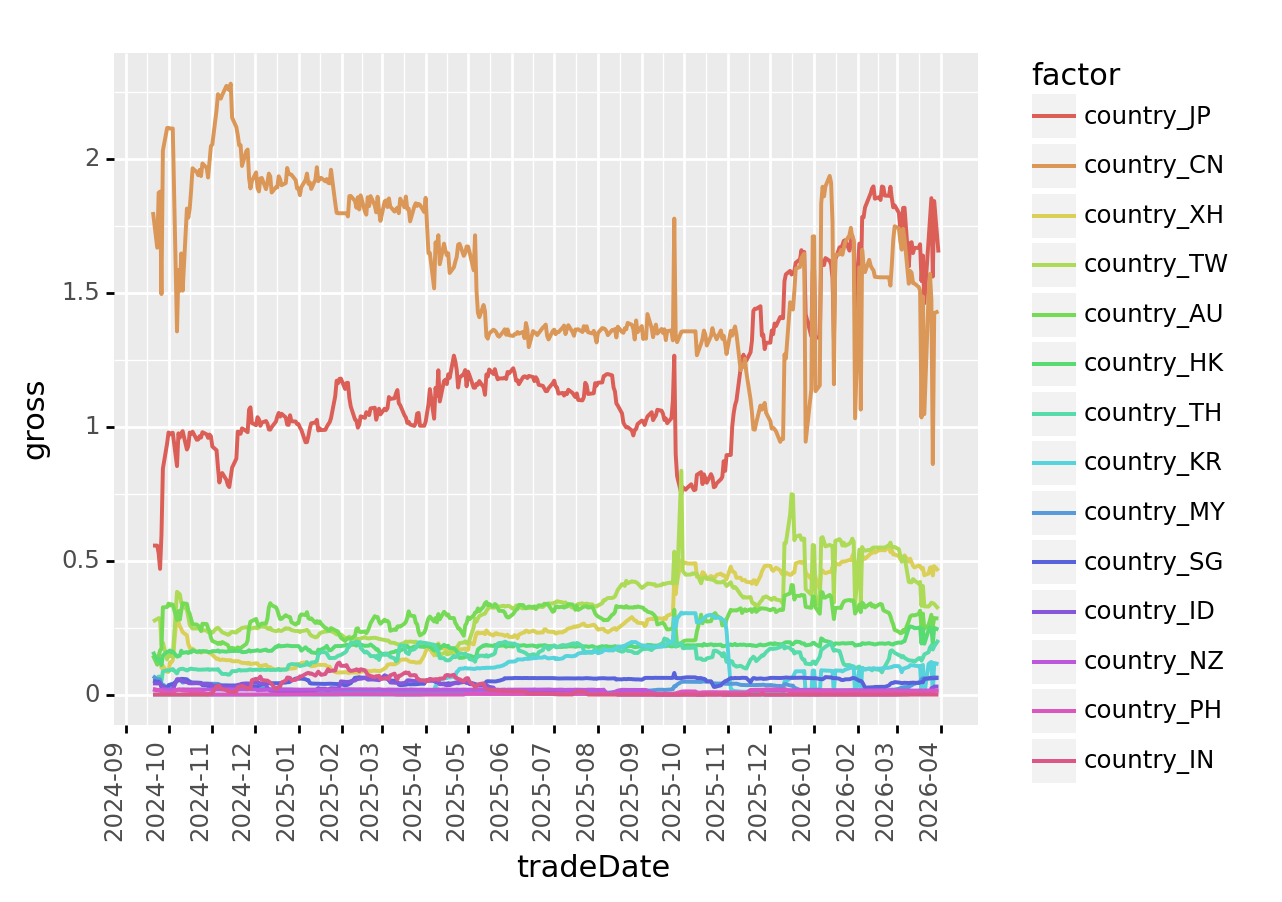
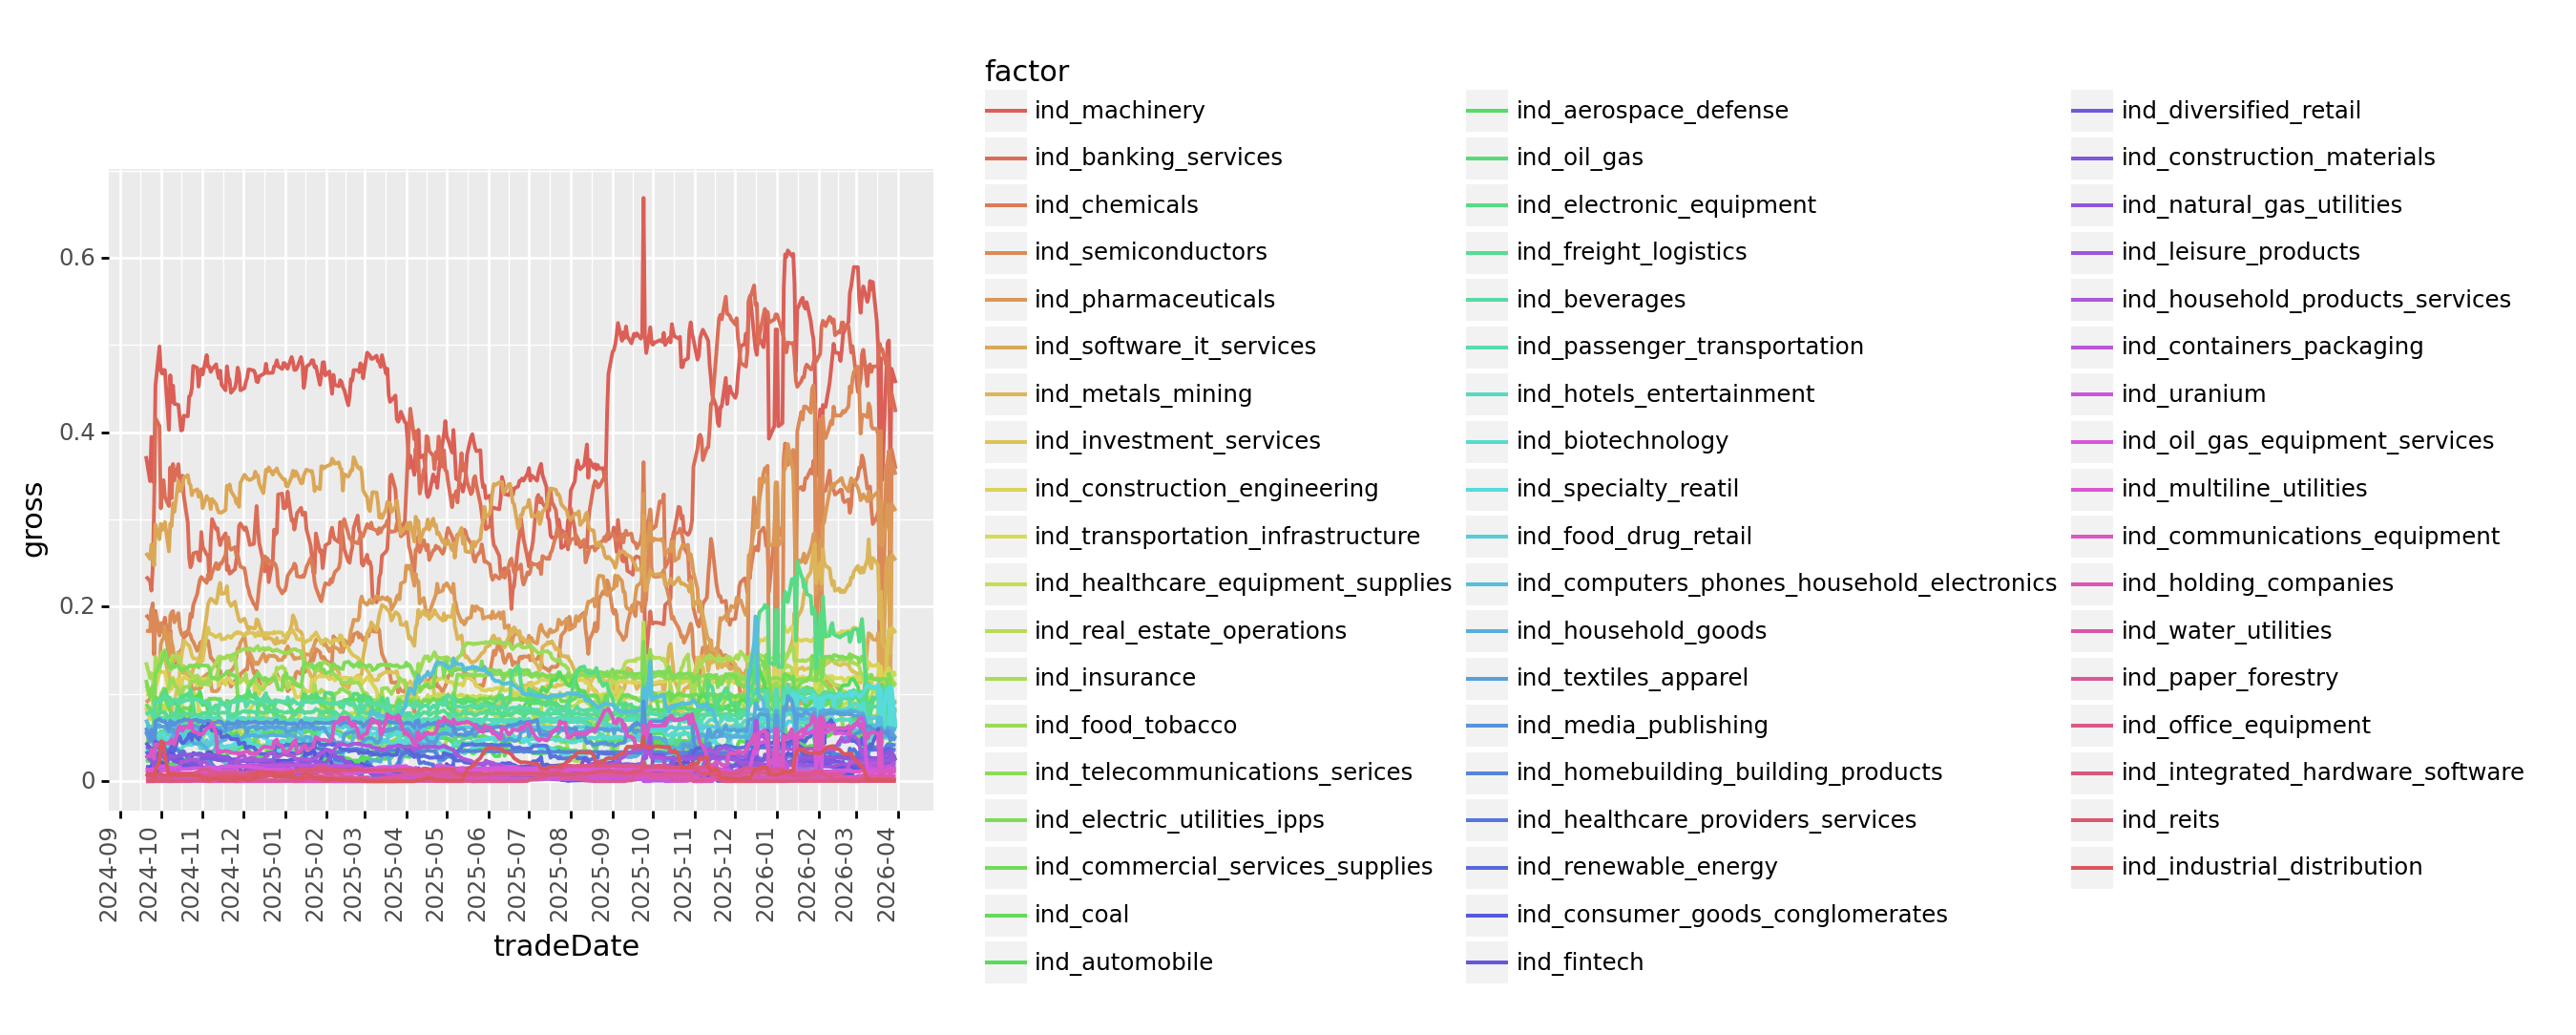
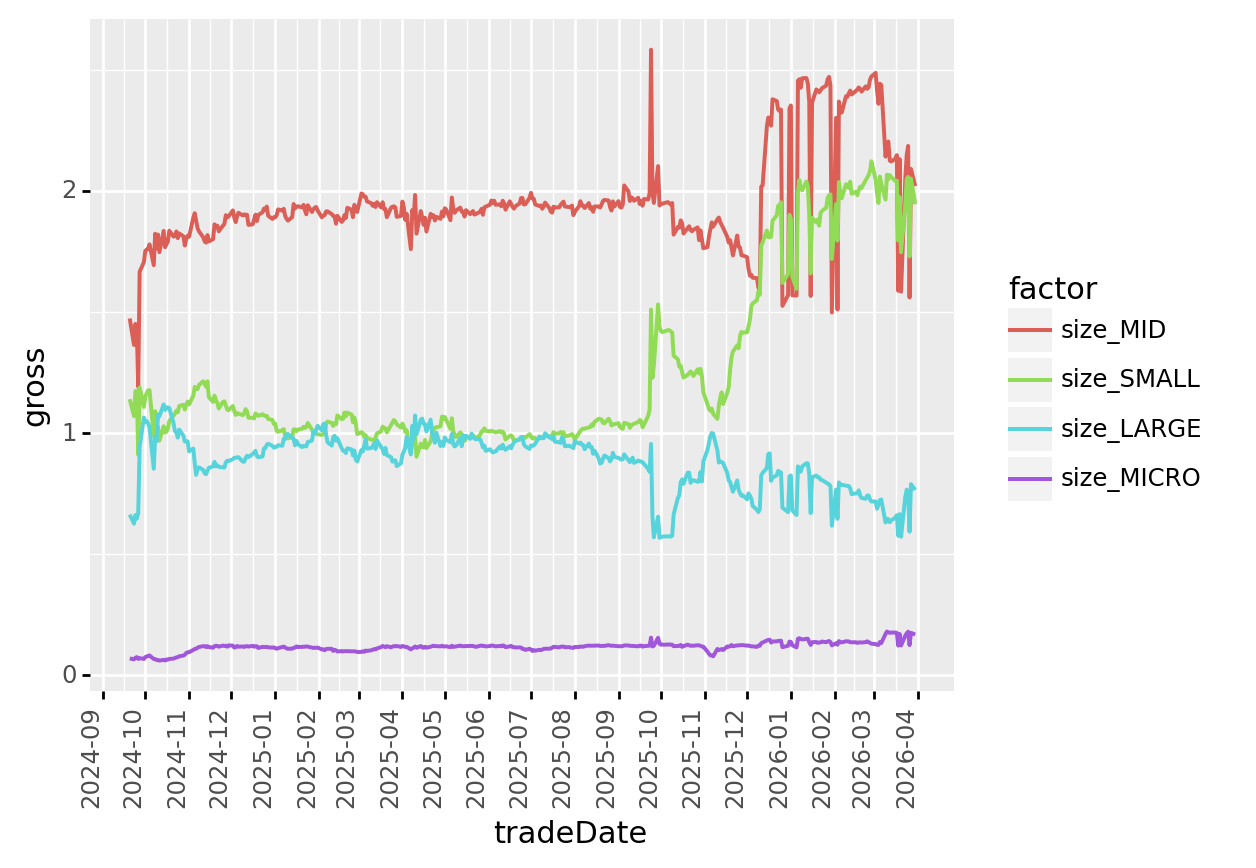
| Country Gross Exp | Industry Gross Exp | Size Gross Exp |
|---|---|---|
 |
 |
 |
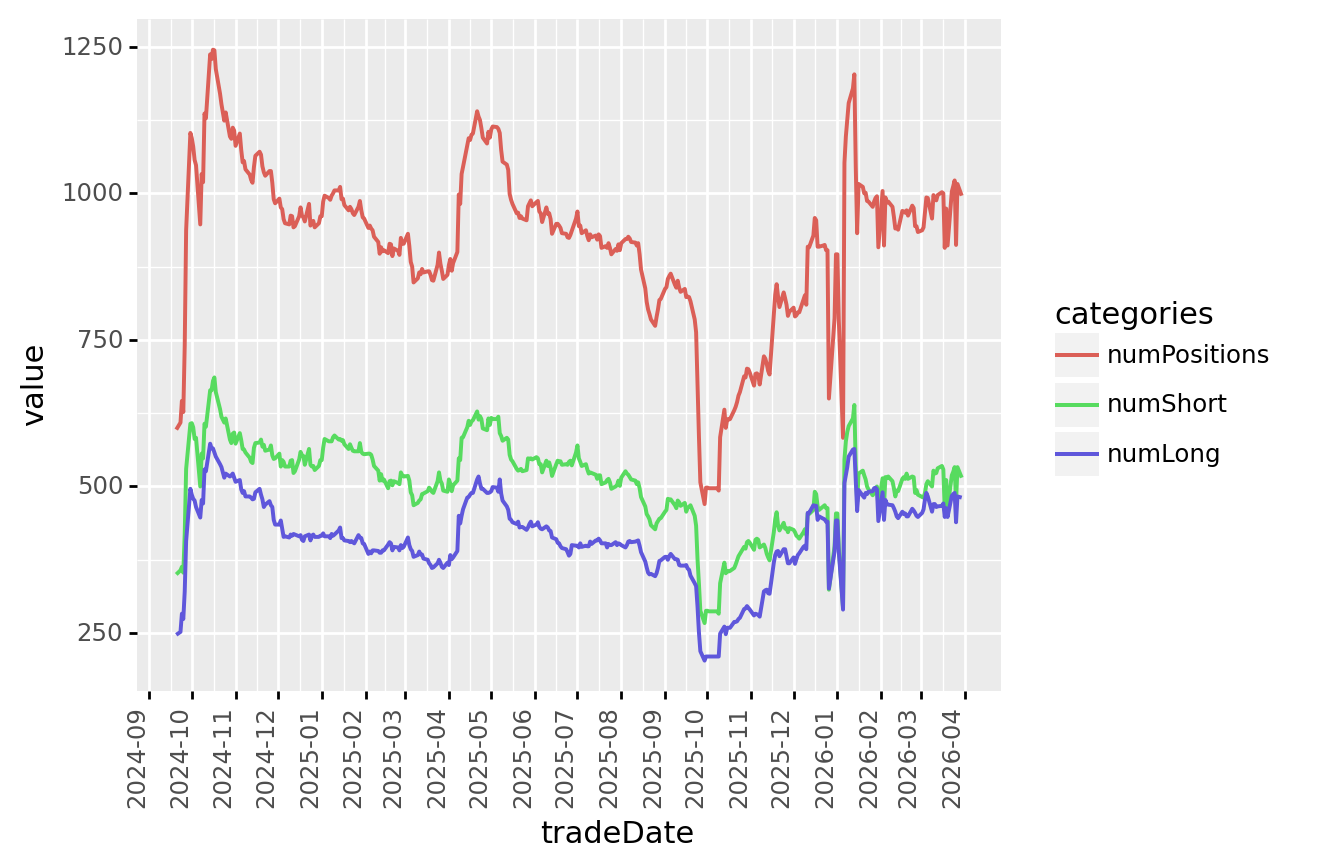
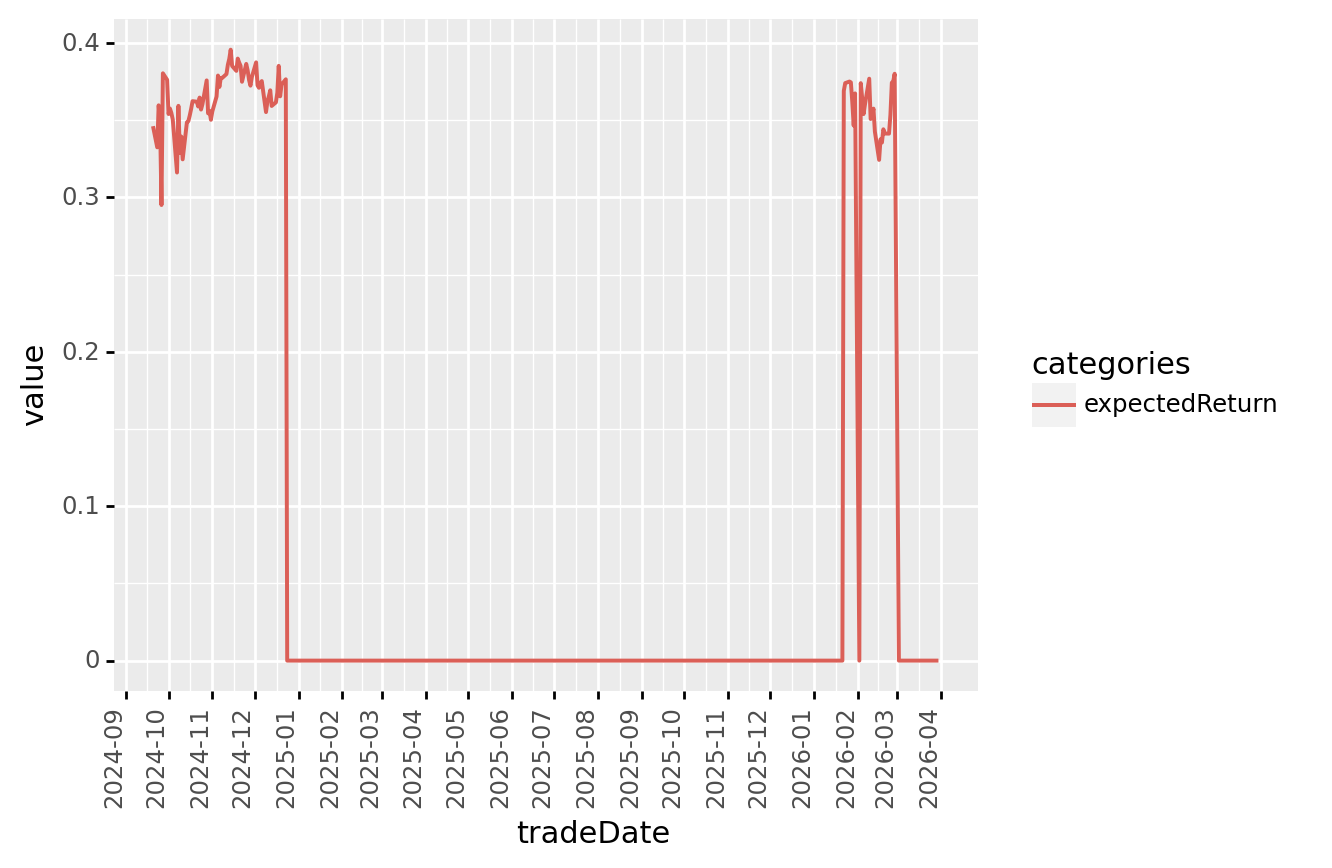
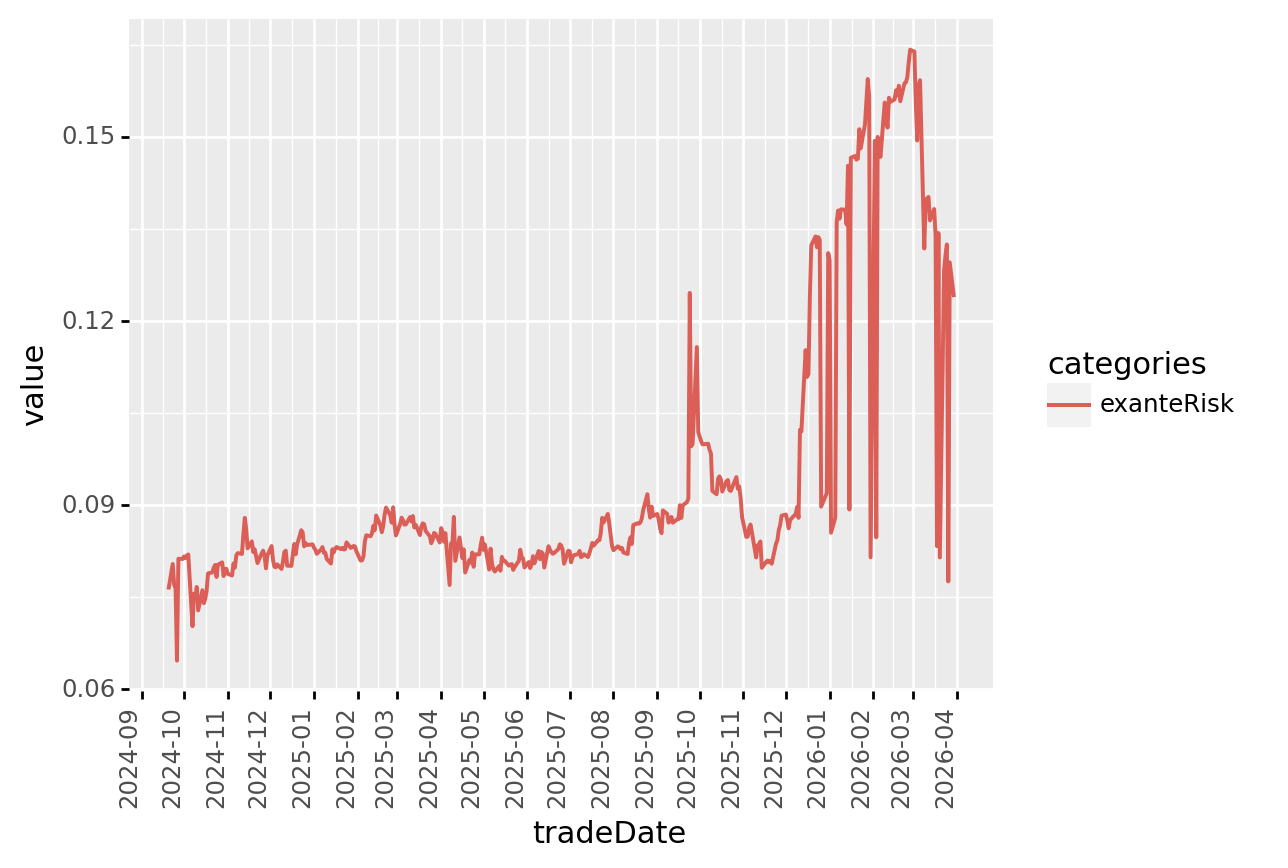
| Number of Positions | Expected Returns | Ex-Ante Risk |
|---|---|---|
 |
 |
 |
| year | IN | PH | NZ | KR | ID | MY | SG | TH | HK | AU | TW | XH | CN | JP | total |
|---|---|---|---|---|---|---|---|---|---|---|---|---|---|---|---|
| 2024 | 0.0295 | 0.0051 | 0.0186 | 0.0000 | 0.0324 | 0.0328 | 0.0401 | 0.0903 | 0.1661 | 0.2525 | 0.2462 | 0.1306 | 1.9503 | 0.9220 | 3.9087 |
| 2025 | 0.0277 | 0.0045 | 0.0148 | 0.0971 | 0.0184 | 0.0169 | 0.0551 | 0.1589 | 0.1792 | 0.2908 | 0.3180 | 0.2612 | 1.4705 | 1.1092 | 4.0217 |
| 2026 | 0.0000 | 0.0142 | 0.0154 | 0.0212 | 0.0235 | 0.0445 | 0.0597 | 0.1111 | 0.1895 | 0.2880 | 0.3542 | 0.4516 | 0.8762 | 1.5454 | 3.9943 |
| year | IN | PH | NZ | KR | ID | MY | SG | TH | HK | AU | TW | XH | CN | JP | total |
|---|---|---|---|---|---|---|---|---|---|---|---|---|---|---|---|
| 2024 | 0.0074 | 0.0014 | 0.0048 | 0.0000 | 0.0084 | 0.0085 | 0.0103 | 0.0230 | 0.0425 | 0.0644 | 0.0633 | 0.0336 | 0.4994 | 0.2350 | 1.0000 |
| 2025 | 0.0069 | 0.0011 | 0.0037 | 0.0239 | 0.0046 | 0.0042 | 0.0137 | 0.0395 | 0.0446 | 0.0724 | 0.0788 | 0.0647 | 0.3659 | 0.2762 | 1.0000 |
| 2026 | 0.0000 | 0.0036 | 0.0038 | 0.0055 | 0.0060 | 0.0112 | 0.0150 | 0.0278 | 0.0475 | 0.0722 | 0.0888 | 0.1132 | 0.2181 | 0.3874 | 1.0000 |